Natural and Historic Environment Topic Data
Dorset’s natural and historic environment plays a vital role in supporting health, wellbeing, and the local economy.
Natural systems provide essential goods—such as food, fuel, clean air and water, and productive soil—and deliver valuable services including pollination, flood protection, climate regulation, and tranquillity.
Download this report (PDF)Landmarks and Landscapes
- 90% of Dorset's (including Christchurch) residents surveyed said the environment was an important, very important or crucial factor in their decision to live in Dorset. In addition, businesses report a demonstrable positive impact from both the Jurassic Coast and the National Landscape1.
- Dorset contains part of England’s only natural World Heritage Site and two National Landscapes, covering 56% of the Dorset Council area2.
- Dorset is home to 9,217 Listed Buildings of which 245 are Grade I3. 5% of England's national protected monuments are in Dorset.
- Dorset's coast is recognised in national or international designations for its unique landscape, scenic quality, wildlife and geological formations2.
Economy and Wellbeing
- Dorset's (including Christchurch) environmental economy is worth between £1.3bn and £3.5bn per annum. It also supports between 17,000 and 61,000 jobs in the economy1.
- The low carbon economy could grow by 11% per year between 2015 and 2030 - four times faster than the rest of the economy4.
- Access to nature supports physical and mental health, yet people in deprived areas are significantly less likely to live near green spaces—highlighting the importance of improving access to reduce environmental inequality9.
- The landscape can reduce the need for expensive public health interventions. Local public health spending on the landscape can be 27 times more cost-effective than clinical interventions.5.
Land Use
- Dorset’s agricultural land area represents 199,534 ha, just over three quarters of Dorset’s total land area. There are just over 2,200 farms in the county.8
- Dorset has just over 30,000 ha9 of woodland cover, which represents 12.1% of Dorset’s land area. This is higher than the national average of 10.3%.8
- There are over 200 national and local environmental designated areas across Dorset.8
- Dorset has 142 km of coastline, much of it designated as a UNESCO World Heritage Site7.
Headline Figures
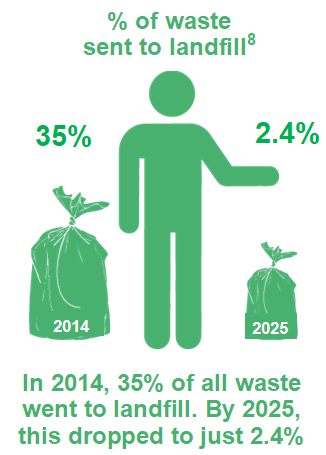
2.4%
of waste is sent to landfill compared to 35% 10 years ago
5%
of all nationally protected ancient monuments are in Dorset
9,217
Listed buildings in Dorset
90%
of Dorset residents prioritised the environment in choosing to live in Dorset
20%
local renewable generation as a percentage of total electricity consumption
56%
of Dorset covered by two National Landscape designations
Headline Figures
2.4%
of waste is sent to landfill compared to 35% 10 years ago
5%
Of all nationally protected ancient monuments are in Dorset
9,217
Listed buildings in Dorset
90%
of Dorset residents prioritised the environment in choosing to live in Dorset
20%
local renewable generation as a percentage of total electricity consumption
56%
of Dorset covered by two National Landscape designations
Sources
- 1 Dorset’s Environmental Economy’, Ash Futures for Dorset County Council, Dorset AONB, Jurassic Coast WHS, Dorset LNP, 2015
- 2 Dorset Databook 2011, Dorset County Council (recalculated)
- 3 The National Heritage List for England (NHLE), Historic England, 17/09/2025
- 4 The Clean Growth Strategy, Department for Business, Energy & Industrial Strategy, 12/10/2017
- 5 Public Health and Landscape, Creating healthy places, Landscape Institute, November 2013
- 6 Recycling Team, Dorset Council
- 7 Dorset Council
- 8 Rural regions and sustainable development in England, University of Exeter 2025
- 9 Included outside: Engaging people living in low-income areas in nature, Natural England, Sept 2022
26 Reports
Order by: Newest first
-
State of Dorset 2025 - Natural Environment
27 January 2026
This is the key annual document bringing together the "picture" of Dorset based on the statistical evidence. This is just the Natural Environment topic
Downloads: 160
-
Tagged:
- Natural and Historic Environment
-
State of Dorset 2025
27 January 2026
This is the key annual document bringing together the "picture" of Dorset based on the statistical evidence.
Downloads: 309
-
State of Dorset 2024 - Natural Environment
28 January 2025
This is the key annual document bringing together the "picture" of Dorset based on the statistical evidence. This is just the Natural Environment topic
Downloads: 379
-
Tagged:
- Natural and Historic Environment
-
State of Dorset 2024
28 January 2025
This is the key annual document bringing together the "picture" of Dorset based on the statistical evidence.
Downloads: 1485
-
State of Dorset 2023 - Natural Environment
01 January 2023
This is the key annual document bringing together the "picture" of Dorset based on the statistical evidence. This report contains just the Natural Environment topic.
Downloads: 463
-
Tagged:
- Natural and Historic Environment
-
State of Dorset 2023
01 January 2023
This is the key annual document bringing together the "picture" of Dorset based on the statistical evidence. It covers eleven key areas: Economy, Deprivation, Older People, Children, Health and Care, Natural and Historic Environment, Leisure and Culture, Crime, Diversity, Population and Housing
Downloads: 1309
-
State of Dorset 2021 – Natural and Historic Environment
06 July 2022
This is the key annual document bringing together the "picture" of Dorset based on the statistical evidence. This report contains the Natural and Historic Environment topic and covers the Dorset Council area.
Downloads: 739
-
Tagged:
- Natural and Historic Environment
-
State of Dorset 2021
06 July 2022
This is the key annual document bringing together the "picture" of Dorset based on the statistical evidence. It covers 10 key areas: Population, Children, Crime, Deprivation, Diversity, Economy, Health and Care, Leisure and Culture, Natural and Historic Environment, and Older People, covering the Dorset Council area.
Downloads: 1917
-
Our Communities Bulletin -The Indices of Multiple Deprivation 2019
07 October 2019
Our latest Our Communities bitesize bulletin looks at the latest release of the official measure of relative deprivation for small areas in England. It focuses on Dorset Council, what’s changed since the last release in 2015 and how the data can be used. The index is measured at a small area level (called Lower-layer Super Output Areas – LSOAs) in England with an average of 1,500 residents in each. In a national context, Dorset as a whole does not score highly in relation to deprivation. However, we still have pockets of deprivation. Read the report to get the overall picture for Dorset.
Downloads: 2231
-
Our Communities - Tourism Bulletin
03 October 2018
This bulletin analyses the economic value of tourism in Dorset and the work being carried out by the council and its partners to promote tourism.
Downloads: 2931
-
Our Communities Topic Report - Dorset's Coastal Communities
06 October 2017
According to a report written by the Social Market Foundation, on average, coastal communities are less productive economically than non-coastal communities. They often have lower levels of pay, higher rates of unemployment and have populations with lower skill levels and poorer health. Four of Dorset's district councils are coastal communities, along with Bournemouth and Poole. The socioeconomic picture across Dorset's coastal communities varies considerably. This bulletin looks at why this matters for Dorset.
Downloads: 2476
-
Bere Regis Ward Factsheet 2016
01 October 2017
A report from Purbeck District Council providing a summary of information on the demographic and socio-economic make up of this ward within Purbeck.
Downloads: 2521
-
Castle Ward Factsheet 2016
01 October 2017
A report from Purbeck District Council providing a summary of information on the demographic and socio-economic make up of this ward within Purbeck.
Downloads: 2235
-
Creech Barrow Ward Factsheet 2016
01 October 2017
A report from Purbeck District Council providing a summary of information on the demographic and socio-economic make up of this ward within Purbeck.
Downloads: 1994
-
Langton Ward Factsheet 2016
01 October 2017
A report from Purbeck District Council providing a summary of information on the demographic and socio-economic make up of this ward within Purbeck.
Downloads: 1791
-
Lulworth & Winfrith Ward Factsheet 2016
01 October 2017
A report from Purbeck District Council providing a summary of information on the demographic and socio-economic make up of this ward within Purbeck.
Downloads: 2055
-
Lytchett Matravers Ward Factsheet 2016
01 October 2017
A report from Purbeck District Council providing a summary of information on the demographic and socio-economic make up of this ward within Purbeck.
Downloads: 2895
-
Lytchett Minster & upton East Ward Factsheet 2016
01 October 2017
A report from Purbeck District Council providing a summary of information on the demographic and socio-economic make up of this ward within Purbeck.
Downloads: 2178
-
Lytchett Minster & Upton West Ward Factsheet 2016
01 October 2017
A report from Purbeck District Council providing a summary of information on the demographic and socio-economic make up of this ward within Purbeck.
Downloads: 1988
-
St Martin Ward Factsheet 2016
01 October 2017
A report from Purbeck District Council providing a summary of information on the demographic and socio-economic make up of this ward within Purbeck.
Downloads: 1594
-
Swanage North Ward Factsheet 2016
01 October 2017
A report from Purbeck District Council providing a summary of information on the demographic and socio-economic make up of this ward within Purbeck.
Downloads: 3222
-
Swanage South Ward Factsheet 2016
01 October 2017
A report from Purbeck District Council providing a summary of information on the demographic and socio-economic make up of this ward within Purbeck.
Downloads: 4606
-
Wareham Ward Factsheet 2016
01 October 2017
A report from Purbeck District Council providing a summary of information on the demographic and socio-economic make up of this ward within Purbeck.
Downloads: 2684
-
Wool Ward Factsheet 2016
01 October 2017
A report from Purbeck District Council providing a summary of information on the demographic and socio-economic make up of this ward within Purbeck.
Downloads: 2323
-
Our Communities Topic Report - Anxiety Bulletin
23 August 2017
Surveys have shown that feelings of anxiety and well-being can change considerably through a person's life. This bulletin looks at anxiety levels across Dorset, including how certain factors can affect levels of anxiety and other measures of well-being.
Downloads: 2221
-
Research Matters 4 - Ask Dorset Public Engagement Results
01 August 2015
Ask Dorset was the biggest community engagement exercise undertaken by Dorset County
Downloads: 2107
9 Related Datasets
Order by: Newest first
-
Indices of Deprivation 2019- National and Dorset Council Ranks
Published: 03 January 2020
The English Indices of Deprivation helps identify and prioritise areas to assist the government and other agencies both national and local in narrowing the gap between deprived neighbourhoods and the rest of the country.
Downloads: 2809
-
Indices of Deprivation 2019 - Dorset East Sub Unitary Geography (SUG) Maps
Published: 11 December 2019
This pdf illustrates national deprivation levels at a small geography across Dorset East SUG area for 2019. There are sixteen maps which look at a range of components of deprivation including health, income, employment, education and skills, living environment, crime and barriers to housing and services. There is also a multiple deprivation map that combines all these aspects of deprivation to give us an overall picture. The document also has a number of maps that look at specific aspects (sub domains) such as deprivation affecting children and outdoor living environment.
Downloads: 1771
-
Indices of Deprivation 2019 - Dorset West Sub Unitary Geography (SUG) Maps
Published: 11 December 2019
This pdf illustrates national deprivation levels at a small geography across Dorset West SUG area for 2019. There are sixteen maps which look at a range of components of deprivation including health, income, employment, education and skills, living environment, crime and barriers to housing and services. There is also a multiple deprivation map that combines all these aspects of deprivation to give us an overall picture. The document also has a number of maps that look at specific aspects (sub domains) such as deprivation affecting children and outdoor living environment.
Downloads: 2327
-
Indices of Deprivation 2019 - Mid Dorset Sub Unitary Geography (SUG) Maps
Published: 11 December 2019
This pdf illustrates national deprivation levels at a small geography across Mid Dorset SUG area for 2019. There are sixteen maps which look at a range of components of deprivation including health, income, employment, education and skills, living environment, crime and barriers to housing and services. There is also a multiple deprivation map that combines all these aspects of deprivation to give us an overall picture. The document also has a number of maps that look at specific aspects (sub domains) such as deprivation affecting children and outdoor living environment.
Downloads: 1925
-
Indices of Deprivation 2019 - South East Dorset Sub Unitary Geography (SUG) Maps
Published: 11 December 2019
This pdf illustrates national deprivation levels at a small geography across South East Dorset SUG area for 2019. There are sixteen maps which look at a range of components of deprivation including health, income, employment, education and skills, living environment, crime and barriers to housing and services. There is also a multiple deprivation map that combines all these aspects of deprivation to give us an overall picture. The document also has a number of maps that look at specific aspects (sub domains) such as deprivation affecting children and outdoor living environment.
Downloads: 2353
-
Indices of Deprivation 2019 - Dorset North Sub Unitary Geography (SUG) Maps
Published: 11 December 2019
This pdf illustrates national deprivation levels at a small geography across Dorset North SUG area for 2019. There are sixteen maps which look at a range of components of deprivation including health, income, employment, education and skills, living environment, crime and barriers to housing and services. There is also a multiple deprivation map that combines all these aspects of deprivation to give us an overall picture. The document also has a number of maps that look at specific aspects (sub domains) such as deprivation affecting children and outdoor living environment.
Downloads: 2100
-
Indices of Deprivation 2019 - Dorset South Sub Unitary Geography (SUG) Maps
Published: 11 December 2019
This pdf illustrates national deprivation levels at a small geography across Dorset South SUG area for 2019. There are sixteen maps which look at a range of components of deprivation including health, income, employment, education and skills, living environment, crime and barriers to housing and services. There is also a multiple deprivation map that combines all these aspects of deprivation to give us an overall picture. The document also has a number of maps that look at specific aspects (sub domains) such as deprivation affecting children and outdoor living environment.
Downloads: 1651
-
Areas of Outstanding Natural Beauty and Areas of Coastal Designations
Published: 01 January 2016
This dataset gives you areas of different designated parts of the County.
Downloads: 1731
-
Tagged:
- Natural and Historic Environment
-
Length of coastline and coastal designation
Published: 01 January 2016
This dataset gives you the length of the different sections of coast.
Downloads: 1735
-
Tagged:
- Natural and Historic Environment