Older People Topic Data
The population of Dorset, like the rest of the UK, is ageing. This trend is more pronounced in Dorset due to its larger older population and declining birth rate. The median age in Dorset is now 52, an increase of 5 years since 2011. In comparison, the median age for England and Wales is 40, up by one year.1
Typically Older People refers to those who are no longer of working age, traditionally 65 and older. However, with increased life expectancy, more people are either having to work or choosing to work beyond the traditional retirement age.
Download this report (PDF)Population
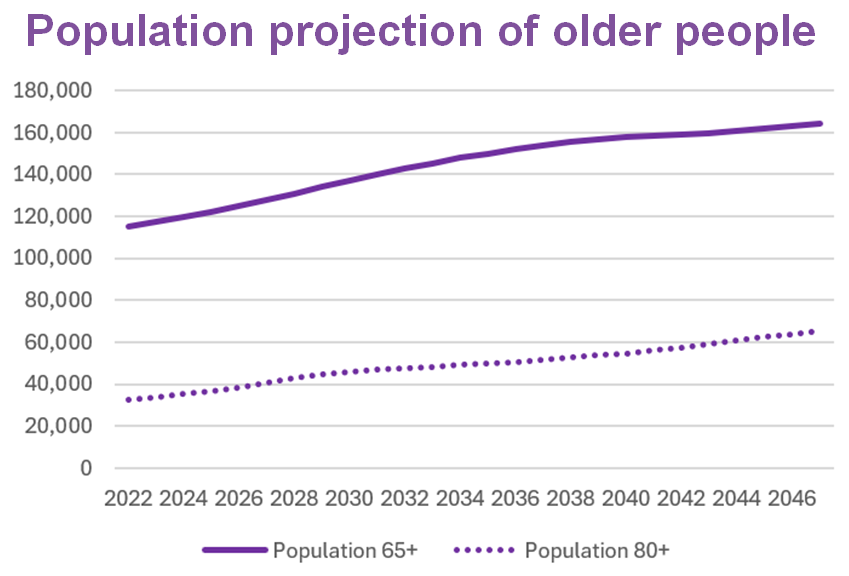
- The population 65+ is projected to grow by 22% between 2025 and 2035 and is projected to increase by 32% by 20452.
- The population aged 80 and older is expected to grow by 36% from 2025 to 2035, and by 71% by 20452.
- Nationwide migration of older people is driven by movement out of urban areas to rural and coastal areas. Net migration figures in Dorset are highest for the 60-64 year old age group3.
- The Old Age Dependency Ratio (OADR) measures the number of people over 65 per 1,000 people aged 16 to 64. In England and Wales the OADR is 297, while in Dorset, it is 5371.
- Nationally, 54% of household growth between 2023 and 2033 will be in homes where the main householder is aged 75 or over. In Dorset, this figure is 87%.
- The population of those 75+ living in care homes or nursing homes is projected to grow by 28% in Dorset, slightly above the average for England of 26%4.
Life Expectancy
- Life expectancy has been increasing at a slower rate in recent years. People aged 65 in Dorset can expect to live for a further 22.5 years for women and 19.8 years for men.5
- People are living longer and healthier lives. In Dorset, healthy life expectancy at 65 is above average. Women can expect 12.8 more years in good/fairly good health, and men 11.6 years. This compares to 11.3 and 10.5 years respectively for England.6
- The life expectancy gap between Dorset’s most and least deprived areas is 4.9 years for males and 3.2 years for females.7 This has decreased since 2020, by two years for females and males.
- In Dorset, around 12,000 people aged 65+ are economically active and employed. This represents nearly 11% of this age group, indicating later retirement trends.
- Additionally, 7% of the economically active population in Dorset are 65 or older, compared to 4% in England and Wales. This highlights a growing reliance on older individuals within the workforce.8
- According to Census 2021 32% of the 35,500 unpaid carers were aged 65 and over compared to 23% for England and Wales. As the population ages, there will be increased need for informal care.
Living well9
- As the population ages in Dorset, older people are more likely to need adaptations to enable them to live independently for longer. With the increase in the cost of living over the past five years, the cost of raw materials and labour has also increased, meaning that alterations and additions to properties are becoming more expensive.
- Dorset’s older people account for almost one third of its population. Levels of internal net migration are highest in older age groups, particularly those aged 55 to 69 years, while levels of net out migration are particularly high for 18 to 29 year olds. This means there will be fewer people to work in the economy and care for our ageing population.
- As the population ages and more older people experience disabilities and health issues, the need for specialist housing will increase. It’s estimated that 20% of all housing will need to be for older people. By 2038, there will be a projected shortfall of 2,800 specialist bedspaces in the community.
Headline Figures
34,926
Population of 80+ year olds in 2024
31%
Aged 65+ in Dorset
19%
Aged 65+ in England & Wales
2.2% pa
Growth in those aged 65+ over next decade
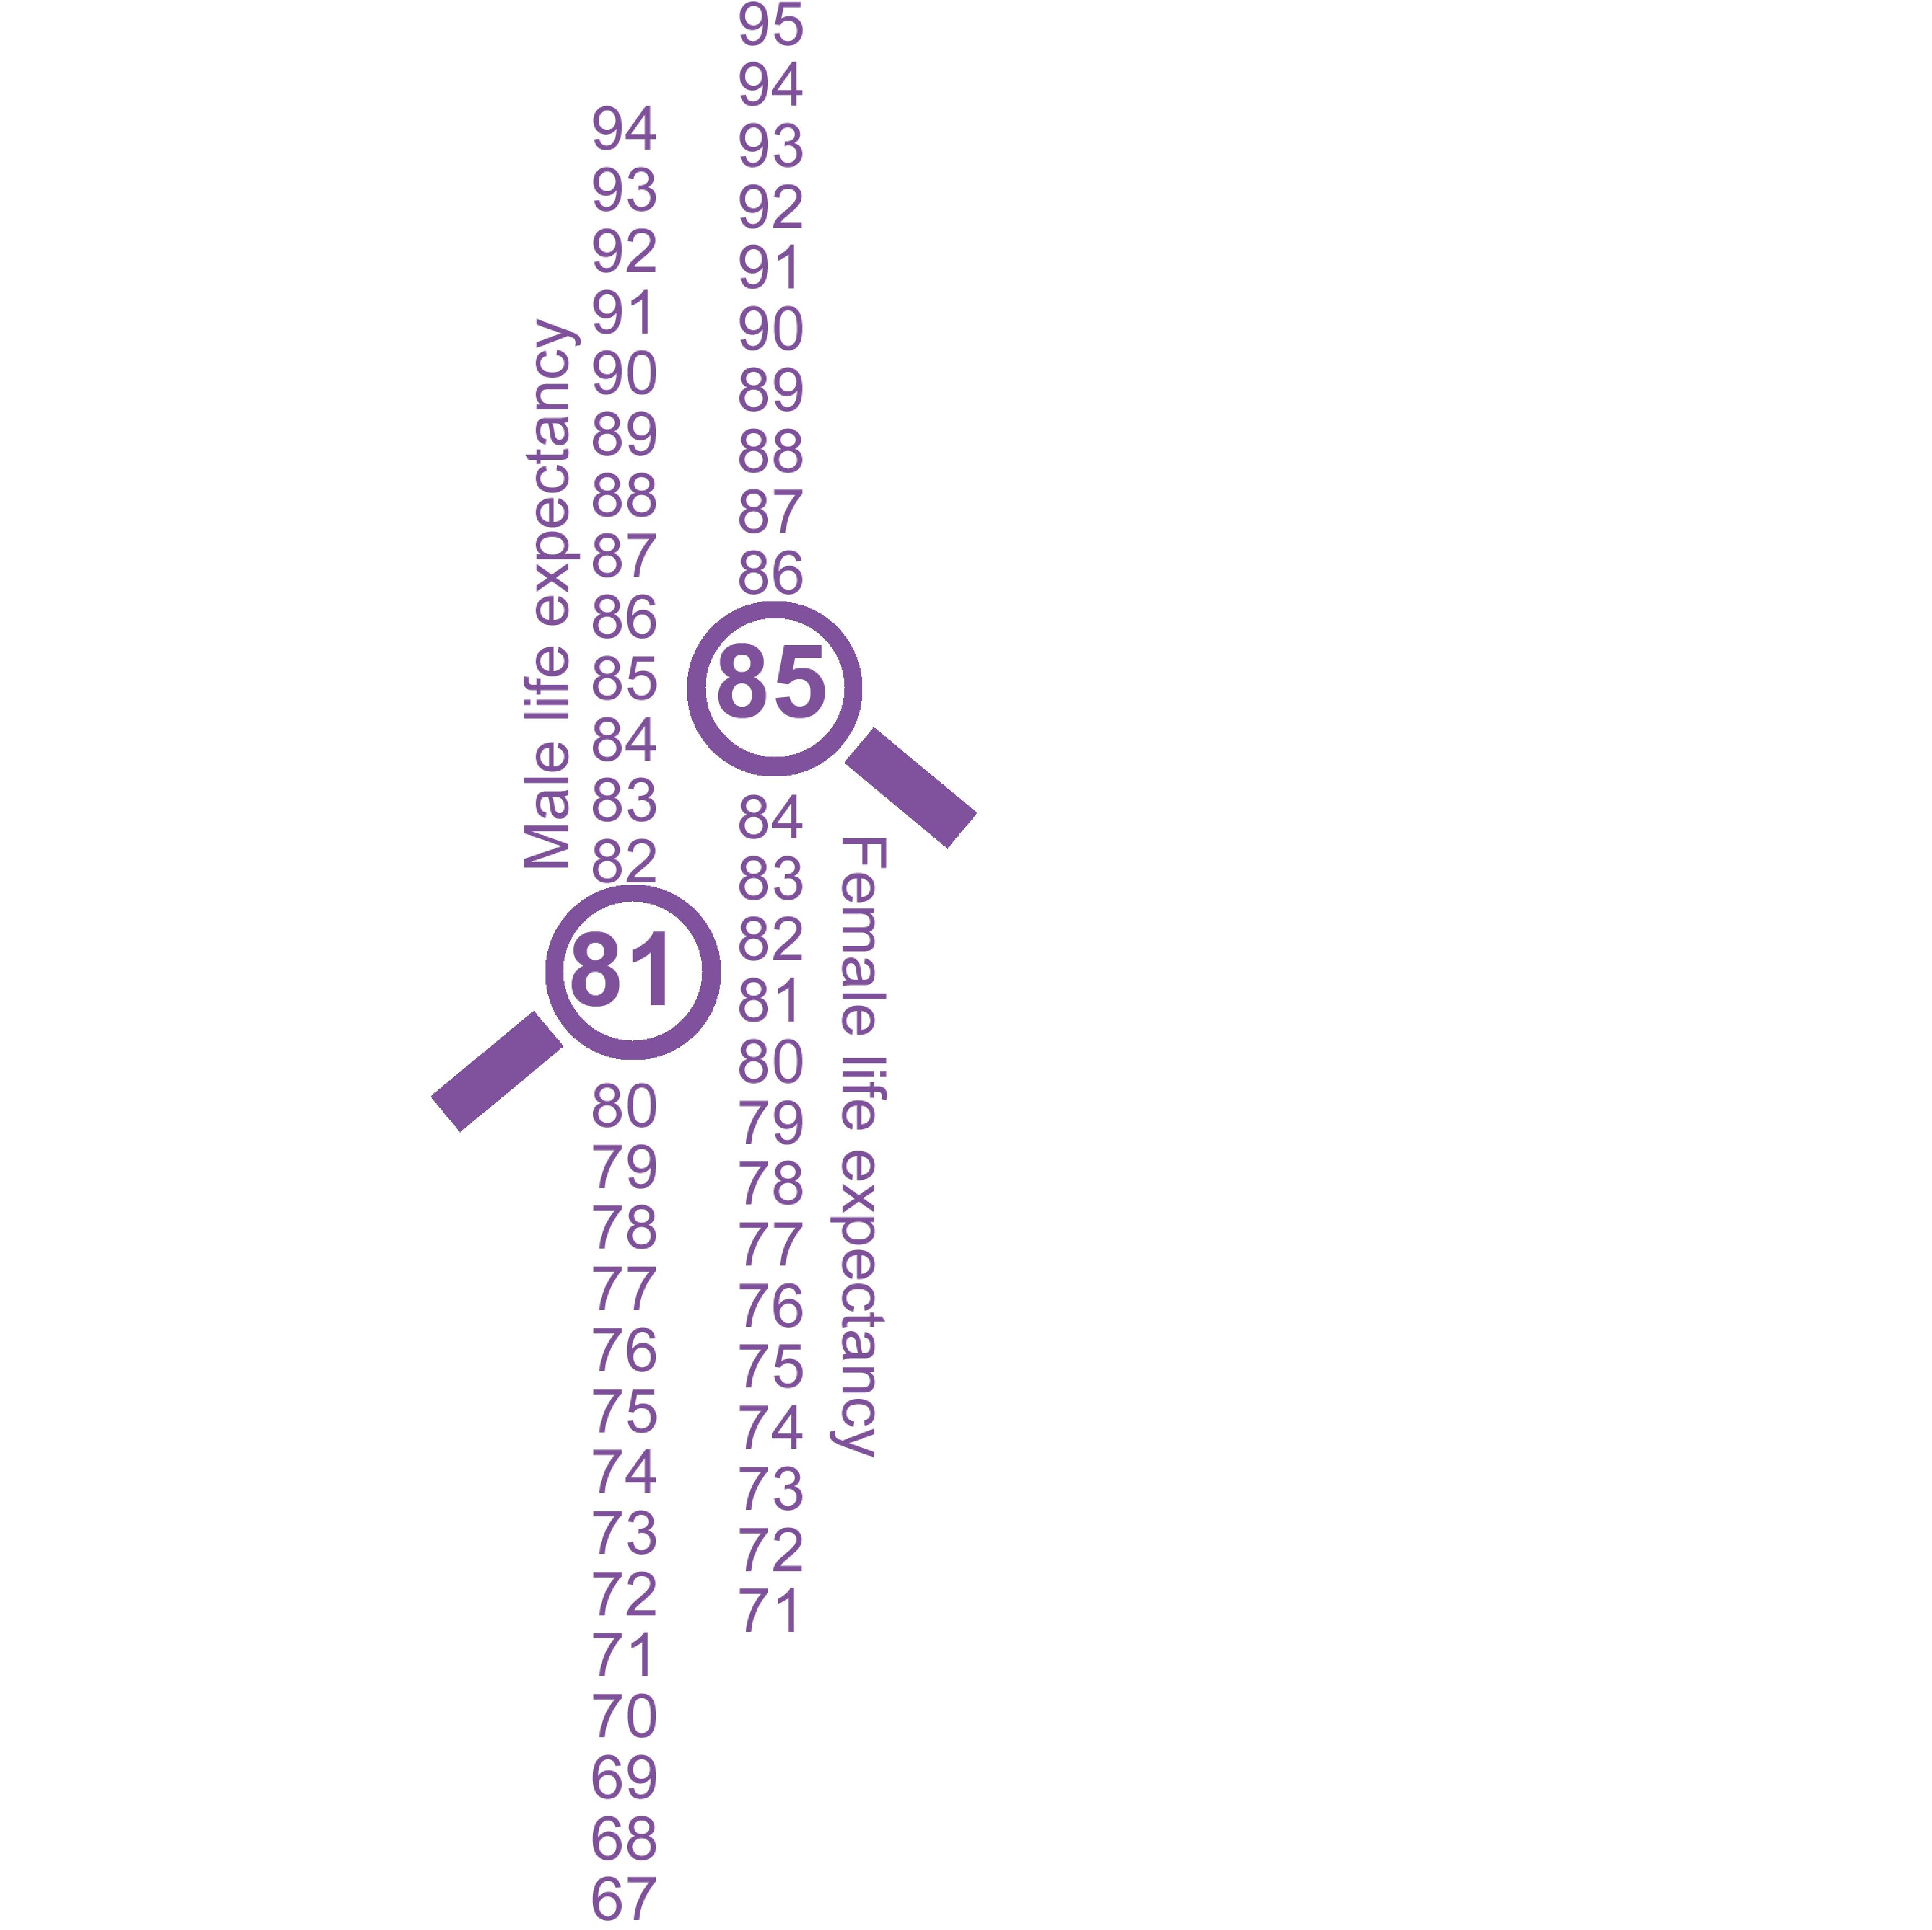
81 years
Life expectancy for males
85 years
Life expectancy for females
Headline Figures
34,926
Population of 80+ year olds in 2024
31%
Aged 65+ in Dorset
19%
Aged 65+ in England & Wales
2.2% pa
Growth in those aged 65+ over next decade
81 years
Life expectancy for males
85 years
Life expectancy for females
Sources
- 1 2024 Mid-year estimates, Office for National Statistics
- 2 2022-ONS based trend population projections, DC
- 3 2021 MYE Internal Migration Estimates, ONS
- 4 2018 based Household Projections, ONS
- 5 Life expectancy at 65 (3 year range, 2020-2022), ONS/Public Health
- 6 Healthy Life Expectancy (2018-20), ONS/Public Health
- 7 Office for Health Improvement and Disparity (2020), Public Health England
- 8 Census 2021
- 9 Dorset and BCP Local Housing Needs Assessment, 2021
40 Reports
Order by: Newest first
-
Research Bulletin - The Indices of Multiple Deprivation 2025
23 April 2026
Our latest Research bulletin looks at the latest release of the official measure of relative deprivation for small areas in England. It focuses on Dorset Council, what’s changed since the previous release and how the data can be used. The index is measured at a small area level (called Lower-layer Super Output Areas – LSOAs) in England with an average of 1,500 residents in each. In a national context, Dorset as a whole does not score highly in relation to deprivation. However, we still have pockets of deprivation. Read the report to get the overall picture for Dorset.
Downloads: 163
-
The Indices of Deprivation 2025 - a summary report for Dorset Council
23 April 2026
The English Indices of Deprivation helps identify and prioritise areas to assist the government and other agencies (both nationally and locally) in narrowing the gap between deprived neighbourhoods and the rest of the country.
Downloads: 233
-
State of Dorset 2025 - Older People
27 January 2026
This is the key annual document bringing together the "picture" of Dorset based on the statistical evidence. This is just the Older People topic
Downloads: 425
-
Tagged:
- Older People
-
State of Dorset 2025
27 January 2026
This is the key annual document bringing together the "picture" of Dorset based on the statistical evidence.
Downloads: 385
-
State of Dorset 2024 - Older People
28 January 2025
This is the key annual document bringing together the "picture" of Dorset based on the statistical evidence. This is just the Older People topic
Downloads: 660
-
Tagged:
- Older People
-
State of Dorset 2024
28 January 2025
This is the key annual document bringing together the "picture" of Dorset based on the statistical evidence.
Downloads: 1570
-
State of Dorset 2023 - Older People
01 January 2023
This is the key annual document bringing together the "picture" of Dorset based on the statistical evidence. This report contains just the Older People topic.
Downloads: 592
-
Tagged:
- Older People
-
State of Dorset 2023
01 January 2023
This is the key annual document bringing together the "picture" of Dorset based on the statistical evidence. It covers eleven key areas: Economy, Deprivation, Older People, Children, Health and Care, Natural and Historic Environment, Leisure and Culture, Crime, Diversity, Population and Housing
Downloads: 1332
-
State of Dorset 2021
06 July 2022
This is the key annual document bringing together the "picture" of Dorset based on the statistical evidence. It covers 10 key areas: Population, Children, Crime, Deprivation, Diversity, Economy, Health and Care, Leisure and Culture, Natural and Historic Environment, and Older People, covering the Dorset Council area.
Downloads: 1930
-
Census 2021 First Release
28 June 2022
First release of Census data from the Office for National Statistics. Population data at local authority level.
Downloads: 1198
-
Tagged:
- Older People
- Children
- Population
-
State of Dorset 2021 - Older People
01 June 2022
This is the key annual document bringing together the "picture" of Dorset based on the statistical evidence. This report contains the Older People topic and covers the Dorset Council area.
Downloads: 1356
-
Tagged:
- Older People
-
The Indices of Deprivation 2019 - a summary report for Dorset Council
28 November 2019
The English Indices of Deprivation helps identify and prioritise areas to assist the government and other agencies (both nationally and locally) in narrowing the gap between deprived neighbourhoods and the rest of the country.
Downloads: 6612
-
Our Communities Bulletin -The Indices of Multiple Deprivation 2019
07 October 2019
Our latest Our Communities bitesize bulletin looks at the latest release of the official measure of relative deprivation for small areas in England. It focuses on Dorset Council, what’s changed since the last release in 2015 and how the data can be used. The index is measured at a small area level (called Lower-layer Super Output Areas – LSOAs) in England with an average of 1,500 residents in each. In a national context, Dorset as a whole does not score highly in relation to deprivation. However, we still have pockets of deprivation. Read the report to get the overall picture for Dorset.
Downloads: 2248
-
2018 Mid-Year Population Estimates in Dorset
10 July 2019
The Office for National Statistics have recently released the 2018 population estimates and components of change for the Dorset Council Area
Downloads: 2061
-
Tagged:
- Older People
- Children
- Population
-
Our Communities Topic report - Brexit Bulletin 2019
21 February 2019
The Office for National Statistics released an analysis showing which parts of the country might feel the most impact of Brexit, based on the representation of employees by sector. This 2019 bulletin looks at the local picture for Dorset, updating our 2017 bulletin.
Downloads: 1726
-
2016 Parish Level Mid-Year Estimates
02 October 2018
Parish level population data from best fit of Census Output Area to parish geographies. Data is in 5yr age groups rounded to the nearest five.
Downloads: 1728
-
Tagged:
- Older People
- Children
- Population
-
2016 ONS Sub-National Population Projections
27 June 2018
The population of DCC Dorset is expected to grow by 9% over the next 25 years according to the Office for National Statistics Sub-National Population Projections.
Downloads: 1741
-
Tagged:
- Economy
- Older People
- Children
- Population
-
Carers in Dorset
14 June 2018
We are in the middle of Carers Week, which runs from 11th-17th June. The focus this year is on supporting carers to be ‘Healthy and Connected’. Research has found that 57% of carers have lost touch with family and friends, over a third (36%) feel uncomfortable talking to friends about caring and one in five carers are forced to give up work due to the demands of caring. 12% of Dorset’s population provides unpaid care, 830 of these are children under the age of 16. The following bulletin gives some information about Carers in Dorset and the impact of caring on the carer’s own health.
Downloads: 2033
-
Our Communities Topic Report - Revised Mid Year Estimates 2012 to 2016
18 April 2018
This new 'Our Communities' bulletin is about the release of revised population estimates from ONS – access to improved data means they have been able to make better estimates of the local impact of migration. Bournemouth – with its significant student population – has seen a considerable downward revision. The impact in the DCC area has been much smaller – an increase of about 200 overall, with the biggest changes evident in North Dorset (-150) and Christchurch (+160). Population data is essential for the County Council for service planning and understanding our communities.
Downloads: 1763
-
Tagged:
- Older People
- Children
- Population
-
Income Levels in Dorset 2016
02 January 2018
A study of income levels in Dorset following the publication of experimental data by the Office for National Statistics
Downloads: 1905
-
Tagged:
- Economy
- Deprivation
- Older People
-
Our Communities Topic Report - Dorset's Coastal Communities
06 October 2017
According to a report written by the Social Market Foundation, on average, coastal communities are less productive economically than non-coastal communities. They often have lower levels of pay, higher rates of unemployment and have populations with lower skill levels and poorer health. Four of Dorset's district councils are coastal communities, along with Bournemouth and Poole. The socioeconomic picture across Dorset's coastal communities varies considerably. This bulletin looks at why this matters for Dorset.
Downloads: 2500
-
Bere Regis Ward Factsheet 2016
01 October 2017
A report from Purbeck District Council providing a summary of information on the demographic and socio-economic make up of this ward within Purbeck.
Downloads: 2544
-
Castle Ward Factsheet 2016
01 October 2017
A report from Purbeck District Council providing a summary of information on the demographic and socio-economic make up of this ward within Purbeck.
Downloads: 2257
-
Creech Barrow Ward Factsheet 2016
01 October 2017
A report from Purbeck District Council providing a summary of information on the demographic and socio-economic make up of this ward within Purbeck.
Downloads: 2003
-
Langton Ward Factsheet 2016
01 October 2017
A report from Purbeck District Council providing a summary of information on the demographic and socio-economic make up of this ward within Purbeck.
Downloads: 1800
-
Lulworth & Winfrith Ward Factsheet 2016
01 October 2017
A report from Purbeck District Council providing a summary of information on the demographic and socio-economic make up of this ward within Purbeck.
Downloads: 2065
-
Lytchett Matravers Ward Factsheet 2016
01 October 2017
A report from Purbeck District Council providing a summary of information on the demographic and socio-economic make up of this ward within Purbeck.
Downloads: 3029
-
Lytchett Minster & upton East Ward Factsheet 2016
01 October 2017
A report from Purbeck District Council providing a summary of information on the demographic and socio-economic make up of this ward within Purbeck.
Downloads: 2197
-
Lytchett Minster & Upton West Ward Factsheet 2016
01 October 2017
A report from Purbeck District Council providing a summary of information on the demographic and socio-economic make up of this ward within Purbeck.
Downloads: 1999
-
St Martin Ward Factsheet 2016
01 October 2017
A report from Purbeck District Council providing a summary of information on the demographic and socio-economic make up of this ward within Purbeck.
Downloads: 1600
-
Swanage North Ward Factsheet 2016
01 October 2017
A report from Purbeck District Council providing a summary of information on the demographic and socio-economic make up of this ward within Purbeck.
Downloads: 3233
-
Swanage South Ward Factsheet 2016
01 October 2017
A report from Purbeck District Council providing a summary of information on the demographic and socio-economic make up of this ward within Purbeck.
Downloads: 4635
-
Wareham Ward Factsheet 2016
01 October 2017
A report from Purbeck District Council providing a summary of information on the demographic and socio-economic make up of this ward within Purbeck.
Downloads: 2724
-
Wool Ward Factsheet 2016
01 October 2017
A report from Purbeck District Council providing a summary of information on the demographic and socio-economic make up of this ward within Purbeck.
Downloads: 2352
-
Our Communities Topic Report - Anxiety Bulletin
23 August 2017
Surveys have shown that feelings of anxiety and well-being can change considerably through a person's life. This bulletin looks at anxiety levels across Dorset, including how certain factors can affect levels of anxiety and other measures of well-being.
Downloads: 2229
-
2016 Mid Year Estimates in Dorset
23 June 2017
A bulletin on the latest mid-year population estimates for Dorset. Looking at the current population for Dorset, its changes and why this matters.
Downloads: 1923
-
Tagged:
- Older People
- Children
- Population
-
Lifelong learning for an ageing workforce
23 May 2017
Earlier in 2017, this report was released by the Skills Commission. “Older workers constitute the single largest pool of untapped potential in Britain. With the challenges that lie ahead, it is crucial we build on their wealth of skills, experience and collective wisdom.” This ourcommunities bitesize bulletin looks at why we need to train older workers in Dorset.
Downloads: 1828
-
Tagged:
- Economy
- Older People
- Population
-
Preparing for the 2021 Census - Testing the next Census in West Dorset, 2017
15 March 2017
The Office for National Statistics (ONS) will be carrying out a census test in West Dorset this year. This is an important part of their preparations for the 2021 Census. The attached document explains in more detail, or go to www.dorsetforyou.com/census-test-2017 for more information.
Downloads: 2002
-
Our Communities Topic Report – Loneliness and Social Isolation in Dorset
01 August 2015
Over recent years, the problems associated with loneliness and social isolation, especially among older people, has become a national priority. One in five Dorset households are vulnerable to social isolation/loneliness. We need to identify areas where loneliness is most prevalent so resources can be targeted at the people and places that need them most.
Downloads: 2518
-
Tagged:
- Older People
- Health and Wellbeing
-
Research Matters 4 - Ask Dorset Public Engagement Results
01 August 2015
Ask Dorset was the biggest community engagement exercise undertaken by Dorset County
Downloads: 2117
19 Related Datasets
Order by: Newest first
-
Indices of Deprivation 2025 - Dorset Council
Published: 23 April 2026
This pdf illustrates national deprivation levels Dorset Council. There are range of maps which look at a range of components of deprivation including health, income, employment, education and skills, living environment, crime and barriers to housing and services. There is also a multiple deprivation map that combines all these aspects of deprivation to give us an overall picture. The document also has a number of maps that look at specific aspects (sub domains) such as deprivation affecting children and outdoor living environment.
Downloads: 95
-
Indices of Deprivation 2025- National and Dorset Council Ranks
Published: 23 April 2026
The English Indices of Deprivation helps identify and prioritise areas to assist the government and other agencies both national and local in narrowing the gap between deprived neighbourhoods and the rest of the country.
Downloads: 95
-
2020 Mid-Year Estimates, Unitary Authority, Historical District and above
Published: 27 July 2021
Annual Mid-Year Estimates produced by the Office for National Statistics
Downloads: 1494
-
Tagged:
- Older People
- Children
- Population
-
2019 Ward Level Population Estimates
Published: 23 December 2020
2019 Office for National Statistics Experimental Population Estimates for Dorset wards
Downloads: 1607
-
Tagged:
- Older People
- Children
- Population
-
2019 LSOA Level Mid-Year Estimates
Published: 08 December 2020
2019 Population estimates for Lower Super Output Area Geographies in Dorset
Downloads: 1384
-
Tagged:
- Economy
- Older People
- Children
-
Internal Migration for Mid-Years 2002-2019
Published: 08 December 2020
Internal Migration by 5 year age group for Dorset Council and Bournemouth, Christchurch & Poole Council
Downloads: 1239
-
Tagged:
- Older People
- Children
- Population
-
Life Expectancy at birth and age 65, 2019
Published: 07 December 2020
Life expectancy at birth and age 65 by sex for Local Authority geography and above.
Downloads: 960
-
Tagged:
- Economy
- Older People
- Population
-
2018 based Household Projections
Published: 20 July 2020
Office for National Statistics 2018 based Household Projections for Dorset
Downloads: 2106
-
Tagged:
- Economy
- Older People
- Population
-
2018 based ONS Population Projections for Dorset
Published: 07 July 2020
2018 based Office for National Statistics Sub National Population Projections for current and former Dorset geographies in five year age groups.
Downloads: 1682
-
Tagged:
- Older People
- Children
- Population
-
2018 Parish Level Mid Year Population Estimates
Published: 23 March 2020
2018 best fit Output Area population to parish geography for all persons by five year age groups.
Downloads: 1426
-
Tagged:
- Deprivation
- Older People
- Children
- Population
-
Indices of Deprivation 2019- National and Dorset Council Ranks
Published: 03 January 2020
The English Indices of Deprivation helps identify and prioritise areas to assist the government and other agencies both national and local in narrowing the gap between deprived neighbourhoods and the rest of the country.
Downloads: 2847
-
Indices of Deprivation 2019 - Dorset East Sub Unitary Geography (SUG) Maps
Published: 11 December 2019
This pdf illustrates national deprivation levels at a small geography across Dorset East SUG area for 2019. There are sixteen maps which look at a range of components of deprivation including health, income, employment, education and skills, living environment, crime and barriers to housing and services. There is also a multiple deprivation map that combines all these aspects of deprivation to give us an overall picture. The document also has a number of maps that look at specific aspects (sub domains) such as deprivation affecting children and outdoor living environment.
Downloads: 1778
-
Indices of Deprivation 2019 - Dorset West Sub Unitary Geography (SUG) Maps
Published: 11 December 2019
This pdf illustrates national deprivation levels at a small geography across Dorset West SUG area for 2019. There are sixteen maps which look at a range of components of deprivation including health, income, employment, education and skills, living environment, crime and barriers to housing and services. There is also a multiple deprivation map that combines all these aspects of deprivation to give us an overall picture. The document also has a number of maps that look at specific aspects (sub domains) such as deprivation affecting children and outdoor living environment.
Downloads: 2332
-
Indices of Deprivation 2019 - Mid Dorset Sub Unitary Geography (SUG) Maps
Published: 11 December 2019
This pdf illustrates national deprivation levels at a small geography across Mid Dorset SUG area for 2019. There are sixteen maps which look at a range of components of deprivation including health, income, employment, education and skills, living environment, crime and barriers to housing and services. There is also a multiple deprivation map that combines all these aspects of deprivation to give us an overall picture. The document also has a number of maps that look at specific aspects (sub domains) such as deprivation affecting children and outdoor living environment.
Downloads: 1930
-
Indices of Deprivation 2019 - South East Dorset Sub Unitary Geography (SUG) Maps
Published: 11 December 2019
This pdf illustrates national deprivation levels at a small geography across South East Dorset SUG area for 2019. There are sixteen maps which look at a range of components of deprivation including health, income, employment, education and skills, living environment, crime and barriers to housing and services. There is also a multiple deprivation map that combines all these aspects of deprivation to give us an overall picture. The document also has a number of maps that look at specific aspects (sub domains) such as deprivation affecting children and outdoor living environment.
Downloads: 2357
-
Indices of Deprivation 2019 - Dorset North Sub Unitary Geography (SUG) Maps
Published: 11 December 2019
This pdf illustrates national deprivation levels at a small geography across Dorset North SUG area for 2019. There are sixteen maps which look at a range of components of deprivation including health, income, employment, education and skills, living environment, crime and barriers to housing and services. There is also a multiple deprivation map that combines all these aspects of deprivation to give us an overall picture. The document also has a number of maps that look at specific aspects (sub domains) such as deprivation affecting children and outdoor living environment.
Downloads: 2105
-
Indices of Deprivation 2019 - Dorset South Sub Unitary Geography (SUG) Maps
Published: 11 December 2019
This pdf illustrates national deprivation levels at a small geography across Dorset South SUG area for 2019. There are sixteen maps which look at a range of components of deprivation including health, income, employment, education and skills, living environment, crime and barriers to housing and services. There is also a multiple deprivation map that combines all these aspects of deprivation to give us an overall picture. The document also has a number of maps that look at specific aspects (sub domains) such as deprivation affecting children and outdoor living environment.
Downloads: 1656
-
Indices of Deprivation 2019 - Dorset Council Maps
Published: 25 November 2019
The combined map base pdf illustrates national deprivation levels at a small geography across Dorset for 2019. There are sixteen maps which look at a range of components of deprivation including health, income, employment, education and skills, living environment, crime and barriers to housing and services. There is also a multiple deprivation (IMD) map that combines all these aspects of deprivation to give us an overall picture for Dorset. The document also has a number of maps that look at specific aspects (sub domains) such as deprivation affecting children and outdoor living environment.
Downloads: 1373
-
POPPI: Projecting Older People Information
Published: 28 July 2014
A population based database providing information on older people (external website)
Downloads: 6832
-
Tagged:
- Older People
- Health and Wellbeing
1 Related Dashboards
-
Indices of Deprivation 2019
This dashboard uses data published by Central Government to measure deprivation in many different facets at a small geography across Dorset.