Population Topic Data
Population projections and changes in Dorset’s demographic profile support planning by indicating how service demands and provision, housing demand, and business needs may evolve. Population change is influenced by natural change (births and deaths) and by migration into and out of the area.
Download this report (PDF)Population change in Dorset
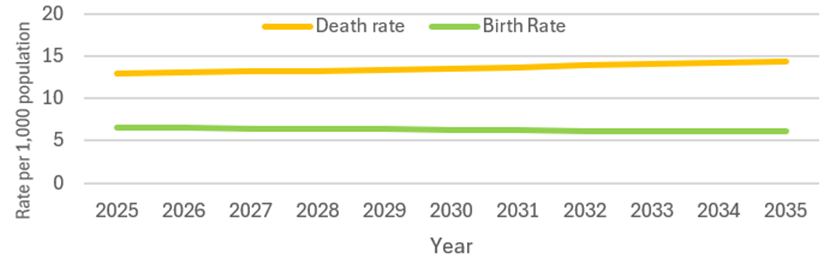
The birth rate in Dorset is projected to fall from 6.6 per 1,000 population in 2025 to 6.1 per 1,000 population in ten years' time. Total number of births in the year 2024/25 were 2,660, total deaths were 4,877. Due to the net decline in natural change (births minus deaths), population growth is driven by migration into the area. The graph below shows the contribution that net migration makes to population growth. Net migration in the year 2023-2024 was 5,100. Mostly internal migration.
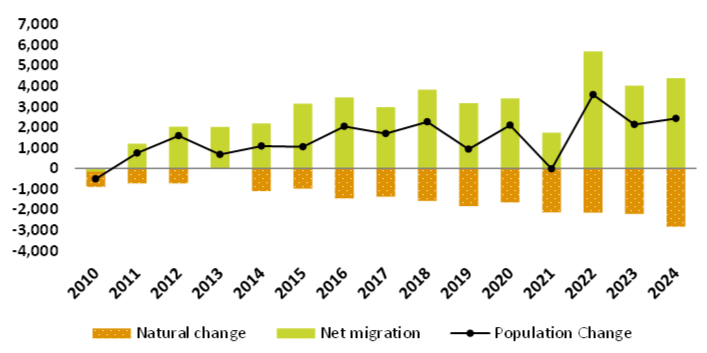
The figure above shows the components of change for each year. Note: from 2022 onwards, figures are projected.
Over the period 2011-2021, Dorset’s population grew by 14,400, a growth of 4% compared with 7% nationally. Over the period 2025 to 2035, the population is projected to grow by another 5% which is the same as the national population.
Age breakdown of population
- Between 2013 and 2023, Dorset’s 65+ population grew by 19,800 (20%) and is projected to rise by 28,400 (24%) by 2033. Its share of the total population is increasing—from 26% in 2013 to 30% in 2023, and an estimated 36% by 2033.
- Dorset’s working-age population (16–64) has remained almost static—down 1,400 between 2013 and 2023, and projected to rise by just 700 by 2033. Meanwhile, the 0–15 age group is expected to fall by 9,200 over the same period.
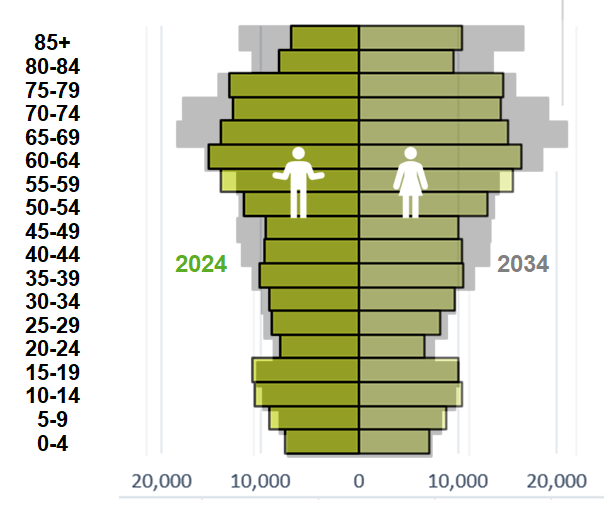
- The population pyramid remains top-heavy and has changed little over the past decade, with further expansion projected by 2034 (grey bars) compared to 2024 (coloured bars).
- The aging of early-1960s baby boomers creates a bulge between ages 55–74, amplified by high net internal migration among 60–69-year-olds.
- Out-migration of young adults is also evident. From age 85+, the chart groups more than five years, making the pyramid appear wider at the top.
Census 2021
- Much of our data and therefore, how we understand the experiences and issues affecting people in Dorset, comes from the Census.
- The Census is carried out every 10 years and Census Day was on 21st March 2021.
- As the Census only happens every 10 years, there is likely to be considerable change in our understanding of the population.
- Census 2021 reflected shifting language and will help with our understanding of marginalised communities, for example asking about Armed Forces service, sexual orientation and gender identity.
- The Census is vital for understanding communities and directing funding where it’s needed. Organisations use Census data to plan, predict, and develop services based on population characteristics.
Headline Figures
5.1%
Projected population change 2025-2035
389,950
Total population in 2024
27,700
Increase in +65 2025-2035
2.3% per year
+65 projected population change 2025-2035
6,540
Decrease in 0-15yrs 2025-2035
Headline Figures
5.1%
Projected population change 2025-2035
389,950
Total population in 2024
27,700
Increase in +65 2025-2035
2.3% per year
+65 projected population change 2025-2035
6,540
Decrease in 0-15yrs 2025-2035
Sources
- 2024 Mid-year estimates, Office for National Statistics
- 2021 Components of Population Change, Office for National Statistics
- 2022 based Dorset Council Continuity projections, Experimental, Dorset Council
43 Reports
Order by: Newest first
-
Research Bulletin - The Indices of Multiple Deprivation 2025
23 April 2026
Our latest Research bulletin looks at the latest release of the official measure of relative deprivation for small areas in England. It focuses on Dorset Council, what’s changed since the previous release and how the data can be used. The index is measured at a small area level (called Lower-layer Super Output Areas – LSOAs) in England with an average of 1,500 residents in each. In a national context, Dorset as a whole does not score highly in relation to deprivation. However, we still have pockets of deprivation. Read the report to get the overall picture for Dorset.
Downloads: 132
-
The Indices of Deprivation 2025 - a summary report for Dorset Council
23 April 2026
The English Indices of Deprivation helps identify and prioritise areas to assist the government and other agencies (both nationally and locally) in narrowing the gap between deprived neighbourhoods and the rest of the country.
Downloads: 168
-
State of Dorset 2025 - Population
27 January 2026
This is the key annual document bringing together the "picture" of Dorset based on the statistical evidence. This is just the Population topic
Downloads: 379
-
Tagged:
- Population
-
State of Dorset 2025
27 January 2026
This is the key annual document bringing together the "picture" of Dorset based on the statistical evidence.
Downloads: 345
-
State of Dorset 2024 - Population
28 January 2025
This is the key annual document bringing together the "picture" of Dorset based on the statistical evidence. This is just the Population topic
Downloads: 1499
-
Tagged:
- Population
-
State of Dorset 2024
28 January 2025
This is the key annual document bringing together the "picture" of Dorset based on the statistical evidence.
Downloads: 1492
-
State of Dorset 2023 - Population
01 January 2023
This is the key annual document bringing together the "picture" of Dorset based on the statistical evidence. This report contains just the Population topic.
Downloads: 962
-
Tagged:
- Population
-
State of Dorset 2023
01 January 2023
This is the key annual document bringing together the "picture" of Dorset based on the statistical evidence. It covers eleven key areas: Economy, Deprivation, Older People, Children, Health and Care, Natural and Historic Environment, Leisure and Culture, Crime, Diversity, Population and Housing
Downloads: 1314
-
State of Dorset 2021 – Population
06 July 2022
This is the key annual document bringing together the "picture" of Dorset based on the statistical evidence. This report contains the Population and covers the Dorset Council area.
Downloads: 1884
-
Tagged:
- Population
-
State of Dorset 2021
06 July 2022
This is the key annual document bringing together the "picture" of Dorset based on the statistical evidence. It covers 10 key areas: Population, Children, Crime, Deprivation, Diversity, Economy, Health and Care, Leisure and Culture, Natural and Historic Environment, and Older People, covering the Dorset Council area.
Downloads: 1924
-
Census 2021 First Release
28 June 2022
First release of Census data from the Office for National Statistics. Population data at local authority level.
Downloads: 1183
-
Tagged:
- Older People
- Children
- Population
-
Dorset Council Residents’ Survey
12 February 2021
The residents' survey is undertaken on an annual basis to gather residents' perceptions on a variety of subjects including quality of life, community cohesion, feelings about Dorset and satisfaction with the council. Online and telephone surveys were carried out with 5,916 Dorset Council residents during October, November and December 2020, and 2,619 responses were used to provide a representative sample of the Dorset Council population.
Downloads: 1540
-
Tagged:
- Population
-
The Indices of Deprivation 2019 - a summary report for Dorset Council
28 November 2019
The English Indices of Deprivation helps identify and prioritise areas to assist the government and other agencies (both nationally and locally) in narrowing the gap between deprived neighbourhoods and the rest of the country.
Downloads: 6599
-
Our Communities Bulletin -The Indices of Multiple Deprivation 2019
07 October 2019
Our latest Our Communities bitesize bulletin looks at the latest release of the official measure of relative deprivation for small areas in England. It focuses on Dorset Council, what’s changed since the last release in 2015 and how the data can be used. The index is measured at a small area level (called Lower-layer Super Output Areas – LSOAs) in England with an average of 1,500 residents in each. In a national context, Dorset as a whole does not score highly in relation to deprivation. However, we still have pockets of deprivation. Read the report to get the overall picture for Dorset.
Downloads: 2238
-
2018 Mid-Year Population Estimates in Dorset
10 July 2019
The Office for National Statistics have recently released the 2018 population estimates and components of change for the Dorset Council Area
Downloads: 2056
-
Tagged:
- Older People
- Children
- Population
-
Our Communities Topic report - Brexit Bulletin 2019
21 February 2019
The Office for National Statistics released an analysis showing which parts of the country might feel the most impact of Brexit, based on the representation of employees by sector. This 2019 bulletin looks at the local picture for Dorset, updating our 2017 bulletin.
Downloads: 1693
-
2016 Parish Level Mid-Year Estimates
02 October 2018
Parish level population data from best fit of Census Output Area to parish geographies. Data is in 5yr age groups rounded to the nearest five.
Downloads: 1714
-
Tagged:
- Older People
- Children
- Population
-
2016 ONS Sub-National Population Projections
27 June 2018
The population of DCC Dorset is expected to grow by 9% over the next 25 years according to the Office for National Statistics Sub-National Population Projections.
Downloads: 1731
-
Tagged:
- Economy
- Older People
- Children
- Population
-
Our Communities Topic Report - Revised Mid Year Estimates 2012 to 2016
18 April 2018
This new 'Our Communities' bulletin is about the release of revised population estimates from ONS – access to improved data means they have been able to make better estimates of the local impact of migration. Bournemouth – with its significant student population – has seen a considerable downward revision. The impact in the DCC area has been much smaller – an increase of about 200 overall, with the biggest changes evident in North Dorset (-150) and Christchurch (+160). Population data is essential for the County Council for service planning and understanding our communities.
Downloads: 1760
-
Tagged:
- Older People
- Children
- Population
-
Our Communities Topic Report - Dorset's Coastal Communities
06 October 2017
According to a report written by the Social Market Foundation, on average, coastal communities are less productive economically than non-coastal communities. They often have lower levels of pay, higher rates of unemployment and have populations with lower skill levels and poorer health. Four of Dorset's district councils are coastal communities, along with Bournemouth and Poole. The socioeconomic picture across Dorset's coastal communities varies considerably. This bulletin looks at why this matters for Dorset.
Downloads: 2488
-
Bere Regis Ward Factsheet 2016
01 October 2017
A report from Purbeck District Council providing a summary of information on the demographic and socio-economic make up of this ward within Purbeck.
Downloads: 2524
-
Castle Ward Factsheet 2016
01 October 2017
A report from Purbeck District Council providing a summary of information on the demographic and socio-economic make up of this ward within Purbeck.
Downloads: 2239
-
Creech Barrow Ward Factsheet 2016
01 October 2017
A report from Purbeck District Council providing a summary of information on the demographic and socio-economic make up of this ward within Purbeck.
Downloads: 1995
-
Langton Ward Factsheet 2016
01 October 2017
A report from Purbeck District Council providing a summary of information on the demographic and socio-economic make up of this ward within Purbeck.
Downloads: 1793
-
Lulworth & Winfrith Ward Factsheet 2016
01 October 2017
A report from Purbeck District Council providing a summary of information on the demographic and socio-economic make up of this ward within Purbeck.
Downloads: 2057
-
Lytchett Matravers Ward Factsheet 2016
01 October 2017
A report from Purbeck District Council providing a summary of information on the demographic and socio-economic make up of this ward within Purbeck.
Downloads: 2903
-
Lytchett Minster & upton East Ward Factsheet 2016
01 October 2017
A report from Purbeck District Council providing a summary of information on the demographic and socio-economic make up of this ward within Purbeck.
Downloads: 2186
-
Lytchett Minster & Upton West Ward Factsheet 2016
01 October 2017
A report from Purbeck District Council providing a summary of information on the demographic and socio-economic make up of this ward within Purbeck.
Downloads: 1994
-
St Martin Ward Factsheet 2016
01 October 2017
A report from Purbeck District Council providing a summary of information on the demographic and socio-economic make up of this ward within Purbeck.
Downloads: 1594
-
Swanage North Ward Factsheet 2016
01 October 2017
A report from Purbeck District Council providing a summary of information on the demographic and socio-economic make up of this ward within Purbeck.
Downloads: 3224
-
Swanage South Ward Factsheet 2016
01 October 2017
A report from Purbeck District Council providing a summary of information on the demographic and socio-economic make up of this ward within Purbeck.
Downloads: 4614
-
Wareham Ward Factsheet 2016
01 October 2017
A report from Purbeck District Council providing a summary of information on the demographic and socio-economic make up of this ward within Purbeck.
Downloads: 2688
-
Wool Ward Factsheet 2016
01 October 2017
A report from Purbeck District Council providing a summary of information on the demographic and socio-economic make up of this ward within Purbeck.
Downloads: 2333
-
Our Communities Topic Report - Anxiety Bulletin
23 August 2017
Surveys have shown that feelings of anxiety and well-being can change considerably through a person's life. This bulletin looks at anxiety levels across Dorset, including how certain factors can affect levels of anxiety and other measures of well-being.
Downloads: 2222
-
2016 Mid Year Estimates in Dorset
23 June 2017
A bulletin on the latest mid-year population estimates for Dorset. Looking at the current population for Dorset, its changes and why this matters.
Downloads: 1919
-
Tagged:
- Older People
- Children
- Population
-
Lifelong learning for an ageing workforce
23 May 2017
Earlier in 2017, this report was released by the Skills Commission. “Older workers constitute the single largest pool of untapped potential in Britain. With the challenges that lie ahead, it is crucial we build on their wealth of skills, experience and collective wisdom.” This ourcommunities bitesize bulletin looks at why we need to train older workers in Dorset.
Downloads: 1822
-
Tagged:
- Economy
- Older People
- Population
-
Preparing for the 2021 Census - Testing the next Census in West Dorset, 2017
15 March 2017
The Office for National Statistics (ONS) will be carrying out a census test in West Dorset this year. This is an important part of their preparations for the 2021 Census. The attached document explains in more detail, or go to www.dorsetforyou.com/census-test-2017 for more information.
Downloads: 1994
-
Our Communities Research Report - Child Poverty in Dorset
08 December 2016
This edition includes a local perspective on a national issue, using data to build a picture of child poverty across the County and identify priority areas.
Downloads: 2338
-
Tagged:
- Deprivation
- Children
- Population
-
Our Communities Topic Report - Crime Bulletin
05 October 2016
This edition will include a local perspective on a national issue using data to build a picture of crime across the County and identify priority areas. Last year there were 2,321 domestic abuse incidents in Dorset and 9,071 anti-social behavioural incidents across Dorset in 2015/16.
Downloads: 1751
-
Tagged:
- Deprivation
- Population
- Crime
-
Research Matters 4 - Ask Dorset Public Engagement Results
01 August 2015
Ask Dorset was the biggest community engagement exercise undertaken by Dorset County
Downloads: 2110
-
Census Story - Country of Birth
01 August 2013
In 2011 5.6 per cent (23,157) of the usual resident population of Dorset were born outside the UK. The national figure for England and Wales was 13.4 per cent (7.5 million).
Downloads: 2620
-
Tagged:
- Population
-
Census Story - Main Language
01 August 2013
98.3% of Dorset’s residents aged 3 and over have recorded English as their main language in the 2011 Census. This contrasts with a figure of 92% for England and Wales. For 6,634 residents in Dorset, English is not their first language. Where English is not the main language spoken 78 other languages feature across the County as resident’s main language, some in very small numbers.
Downloads: 2505
-
Tagged:
- Population
-
Census Story - Religion
01 August 2013
Despite falling numbers Christianity remains the largest religion in Dorset in 2011. Meanwhile a quarter of the population now say they have no religion.
Downloads: 2437
-
Tagged:
- Population
24 Related Datasets
Order by: Newest first
-
Indices of Deprivation 2025 - Dorset Council
Published: 23 April 2026
This pdf illustrates national deprivation levels Dorset Council. There are range of maps which look at a range of components of deprivation including health, income, employment, education and skills, living environment, crime and barriers to housing and services. There is also a multiple deprivation map that combines all these aspects of deprivation to give us an overall picture. The document also has a number of maps that look at specific aspects (sub domains) such as deprivation affecting children and outdoor living environment.
Downloads: 77
-
Indices of Deprivation 2025- National and Dorset Council Ranks
Published: 23 April 2026
The English Indices of Deprivation helps identify and prioritise areas to assist the government and other agencies both national and local in narrowing the gap between deprived neighbourhoods and the rest of the country.
Downloads: 73
-
NINO Registrations 2021
Published: 18 July 2022
This dataset includes total NINO registrations 2002 to 2021 as well as the most common country of origin in 2021.
Downloads: 667
-
Tagged:
- Economy
- Population
- Diversity
-
2020 Mid-Year Estimates, Unitary Authority, Historical District and above
Published: 27 July 2021
Annual Mid-Year Estimates produced by the Office for National Statistics
Downloads: 1468
-
Tagged:
- Older People
- Children
- Population
-
2019 Ward Level Population Estimates
Published: 23 December 2020
2019 Office for National Statistics Experimental Population Estimates for Dorset wards
Downloads: 1602
-
Tagged:
- Older People
- Children
- Population
-
National Insurance Registrations to overseas Nationals 2019-20
Published: 09 December 2020
National Insurance Registrations to overseas Nationals 2019-20
Downloads: 1317
-
Tagged:
- Economy
- Population
- Diversity
-
Births Deaths and Natural Change by Country and Local Authority
Published: 08 December 2020
Local Authority births, deaths and natural change from Mid-Years 2002 to 2019
Downloads: 1143
-
Tagged:
- Children
- Health and Wellbeing
- Population
-
Internal Migration for Mid-Years 2002-2019
Published: 08 December 2020
Internal Migration by 5 year age group for Dorset Council and Bournemouth, Christchurch & Poole Council
Downloads: 1221
-
Tagged:
- Older People
- Children
- Population
-
International Migration for Mid-Years 2002-2019
Published: 08 December 2020
International Migration by 5 year age group for Dorset Council and Bournemouth, Christchurch & Poole Council
Downloads: 1060
-
Tagged:
- Economy
- Population
- Diversity
-
Life Expectancy at birth and age 65, 2019
Published: 07 December 2020
Life expectancy at birth and age 65 by sex for Local Authority geography and above.
Downloads: 956
-
Tagged:
- Economy
- Older People
- Population
-
ONS Sexual Orientation Data at LA Geography (experimental dataset)
Published: 27 November 2020
Office for National Statistics experimental data on sexual orientation at LA Geography 2016-2018
Downloads: 916
-
Tagged:
- Population
- Diversity
-
Data for EqIAs (diversity data)
Published: 14 November 2020
Various diversity data for Dorset with national comparators. For assistance in completing Equality Impact Assessments (EqIAs).
Downloads: 1355
-
2018 based Household Projections
Published: 20 July 2020
Office for National Statistics 2018 based Household Projections for Dorset
Downloads: 2096
-
Tagged:
- Economy
- Older People
- Population
-
2018 based ONS Population Projections for Dorset
Published: 07 July 2020
2018 based Office for National Statistics Sub National Population Projections for current and former Dorset geographies in five year age groups.
Downloads: 1663
-
Tagged:
- Older People
- Children
- Population
-
2018 Parish Level Mid Year Population Estimates
Published: 23 March 2020
2018 best fit Output Area population to parish geography for all persons by five year age groups.
Downloads: 1423
-
Tagged:
- Deprivation
- Older People
- Children
- Population
-
Indices of Deprivation 2019- National and Dorset Council Ranks
Published: 03 January 2020
The English Indices of Deprivation helps identify and prioritise areas to assist the government and other agencies both national and local in narrowing the gap between deprived neighbourhoods and the rest of the country.
Downloads: 2819
-
Indices of Deprivation 2019 - Dorset East Sub Unitary Geography (SUG) Maps
Published: 11 December 2019
This pdf illustrates national deprivation levels at a small geography across Dorset East SUG area for 2019. There are sixteen maps which look at a range of components of deprivation including health, income, employment, education and skills, living environment, crime and barriers to housing and services. There is also a multiple deprivation map that combines all these aspects of deprivation to give us an overall picture. The document also has a number of maps that look at specific aspects (sub domains) such as deprivation affecting children and outdoor living environment.
Downloads: 1773
-
Indices of Deprivation 2019 - Dorset West Sub Unitary Geography (SUG) Maps
Published: 11 December 2019
This pdf illustrates national deprivation levels at a small geography across Dorset West SUG area for 2019. There are sixteen maps which look at a range of components of deprivation including health, income, employment, education and skills, living environment, crime and barriers to housing and services. There is also a multiple deprivation map that combines all these aspects of deprivation to give us an overall picture. The document also has a number of maps that look at specific aspects (sub domains) such as deprivation affecting children and outdoor living environment.
Downloads: 2327
-
Indices of Deprivation 2019 - Mid Dorset Sub Unitary Geography (SUG) Maps
Published: 11 December 2019
This pdf illustrates national deprivation levels at a small geography across Mid Dorset SUG area for 2019. There are sixteen maps which look at a range of components of deprivation including health, income, employment, education and skills, living environment, crime and barriers to housing and services. There is also a multiple deprivation map that combines all these aspects of deprivation to give us an overall picture. The document also has a number of maps that look at specific aspects (sub domains) such as deprivation affecting children and outdoor living environment.
Downloads: 1928
-
Indices of Deprivation 2019 - South East Dorset Sub Unitary Geography (SUG) Maps
Published: 11 December 2019
This pdf illustrates national deprivation levels at a small geography across South East Dorset SUG area for 2019. There are sixteen maps which look at a range of components of deprivation including health, income, employment, education and skills, living environment, crime and barriers to housing and services. There is also a multiple deprivation map that combines all these aspects of deprivation to give us an overall picture. The document also has a number of maps that look at specific aspects (sub domains) such as deprivation affecting children and outdoor living environment.
Downloads: 2354
-
Indices of Deprivation 2019 - Dorset North Sub Unitary Geography (SUG) Maps
Published: 11 December 2019
This pdf illustrates national deprivation levels at a small geography across Dorset North SUG area for 2019. There are sixteen maps which look at a range of components of deprivation including health, income, employment, education and skills, living environment, crime and barriers to housing and services. There is also a multiple deprivation map that combines all these aspects of deprivation to give us an overall picture. The document also has a number of maps that look at specific aspects (sub domains) such as deprivation affecting children and outdoor living environment.
Downloads: 2101
-
Indices of Deprivation 2019 - Dorset South Sub Unitary Geography (SUG) Maps
Published: 11 December 2019
This pdf illustrates national deprivation levels at a small geography across Dorset South SUG area for 2019. There are sixteen maps which look at a range of components of deprivation including health, income, employment, education and skills, living environment, crime and barriers to housing and services. There is also a multiple deprivation map that combines all these aspects of deprivation to give us an overall picture. The document also has a number of maps that look at specific aspects (sub domains) such as deprivation affecting children and outdoor living environment.
Downloads: 1652
-
Indices of Deprivation 2019 - Dorset Council Maps
Published: 25 November 2019
The combined map base pdf illustrates national deprivation levels at a small geography across Dorset for 2019. There are sixteen maps which look at a range of components of deprivation including health, income, employment, education and skills, living environment, crime and barriers to housing and services. There is also a multiple deprivation (IMD) map that combines all these aspects of deprivation to give us an overall picture for Dorset. The document also has a number of maps that look at specific aspects (sub domains) such as deprivation affecting children and outdoor living environment.
Downloads: 1369
-
Ethnicity
Published: 01 January 2011
Broad and detailed ethnic population data at District level and above
Downloads: 2120
-
Tagged:
- Population
1 Related Dashboards
-
Indices of Deprivation 2019
This dashboard uses data published by Central Government to measure deprivation in many different facets at a small geography across Dorset.