Children Topic Data
According to the latest estimates from the ONS there are 67,150 0 to 17 year olds living in Dorset. As a proportion of our total population this has remained relatively stable since 2020 at around 17% of the population compared to a figure of 21% for England and Wales.
Between 2025 and 2035 the number of 0-4 year olds is expected to decrease by about 800 while the number of 5-15 year olds is projected to decrease by about 5,800.
Download this report (PDF)Special Educational Need3
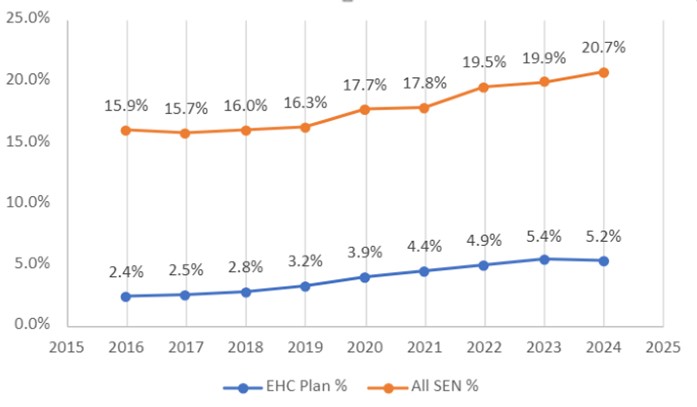
The percentage of children with Special Educational Need has increased in Dorset each year since 2017. The figure has increased from 17.8% in 2021 to 21.3% in 2025. The percentage with either a statement or an EHC Plan has more than doubled over the past ten years, from 2.4% to 6.0%.
- One in four pupils with an EHC plan has an Autistic Spectrum Condition and just over one in five have speech, language and communication needs.
- It is likely that a pupil may have more than one special educational need.
- 63% of pupils with an EHC Plan are educated in Mainstream Schools in Dorset.
- 70% of Dorset Council school pupils with an EHC are boys and 57% with SEN Support are boys. This is very similar to the national picture. The proportion of girls with SEN is increasing.
Education3
- We currently have just over 46,300 pupils attending schools in Dorset.
- There are 158 schools in Dorset with a small number operating in more than one location across the Council area.
- Different areas of Dorset have either a two-tier system which have a Primary (including Junior and Infant) and Secondary and other areas have a three-tier system which includes Primary, Middle and Secondary. Also some Secondary schools run from 11 to 18 including a sixth form whilst others are from 11 to 16. There are no grammar schools in the Dorset Council area.
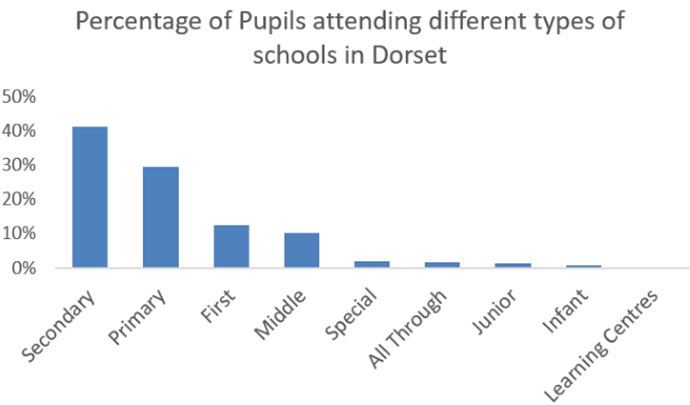
- Just over 40% of Dorset Council’s school pupils attend Secondary Schools and 10% attend Middle Schools. 45% attend Primary Schools including infants and Juniors. Approximately 2% attend Special Schools and less than 1% attend Learning Centres.
- School sizes vary dramatically from the biggest Secondary School with just over 2,000 pupils to small rural schools with less than 50 pupils.
Post-16 opportunities4
- The percentage of 16 and 17 year olds in Dorset in education or training in 2024 was 91.6% - a bit higher than the South West at 90.7% and very similar to England 92.1%.
- Accessing services is a considerable issue in rural Dorset. Approximately 44% of Dorset residents fall within the top 20% most geographically deprived in England for access to a range of services, including schools.
- Travel time to the nearest further education college by public transport/walking in Dorset is 31 minutes— one of the 10 highest of any Unitary Authority in England. This compares to 21 minutes for England and 25 minutes for the South West.
- However, Dorset has strong participation in ‘Higher’ level apprenticeships, with 3,333 participants aged 16 and over per 100,000 population. This compares to 2,369 in the South West and 2,031 nationally, making Dorset one of the highest-ranking Unitary Authorities in England.
-
There are two levels of a ‘Higher’ apprenticeship Level 4 and Level 5:
- Level 4 apprenticeships are equivalent to the first year of an undergraduate degree, or a Higher National Certificate.
- Level 5 apprenticeships are equivalent to a foundation degree, or a Higher National Diploma.
Headline Figures2,3
67,150
Total children
3.7%
Primary school children with a SEN or EHC plan
419
Children and young people in care in Dorset
69
Looked after children in every 10,000 in Dorset
63%
Pupils with an EHC Plan educated in mainstream schools
25%
Percentage of pupils achieving 9-5 in English and Maths (Free School Meals Gap)
Sources
- 1 2022-trend based ONS population projections
- 2 2024 MYE, 0-17 year-olds, ONS
- 3 Dorset Council, Children’s Services October 31 2025
- 4 Local Government Inform 2024/25
40 Reports
Order by: Newest first
-
Research Bulletin - The Indices of Multiple Deprivation 2025
23 April 2026
Our latest Research bulletin looks at the latest release of the official measure of relative deprivation for small areas in England. It focuses on Dorset Council, what’s changed since the previous release and how the data can be used. The index is measured at a small area level (called Lower-layer Super Output Areas – LSOAs) in England with an average of 1,500 residents in each. In a national context, Dorset as a whole does not score highly in relation to deprivation. However, we still have pockets of deprivation. Read the report to get the overall picture for Dorset.
Downloads: 164
-
The Indices of Deprivation 2025 - a summary report for Dorset Council
23 April 2026
The English Indices of Deprivation helps identify and prioritise areas to assist the government and other agencies (both nationally and locally) in narrowing the gap between deprived neighbourhoods and the rest of the country.
Downloads: 233
-
State of Dorset 2025 - Children
27 January 2026
This is the key annual document bringing together the "picture" of Dorset based on the statistical evidence. This is just the Children topic
Downloads: 187
-
Tagged:
- Children
-
State of Dorset 2025
27 January 2026
This is the key annual document bringing together the "picture" of Dorset based on the statistical evidence.
Downloads: 385
-
State of Dorset 2024 - Children
28 January 2025
This is the key annual document bringing together the "picture" of Dorset based on the statistical evidence. This is just the Children topic
Downloads: 521
-
Tagged:
- Children
-
State of Dorset 2024
28 January 2025
This is the key annual document bringing together the "picture" of Dorset based on the statistical evidence.
Downloads: 1570
-
State of Dorset 2023 - Children
01 January 2023
This is the key annual document bringing together the "picture" of Dorset based on the statistical evidence. This report contains just the Children topic.
Downloads: 602
-
Tagged:
- Children
-
State of Dorset 2023
01 January 2023
This is the key annual document bringing together the "picture" of Dorset based on the statistical evidence. It covers eleven key areas: Economy, Deprivation, Older People, Children, Health and Care, Natural and Historic Environment, Leisure and Culture, Crime, Diversity, Population and Housing
Downloads: 1332
-
State of Dorset 2021 – Children
06 July 2022
This is the key annual document bringing together the "picture" of Dorset based on the statistical evidence. This report contains the Children topic and covers the Dorset Council area.
Downloads: 1240
-
Tagged:
- Children
-
State of Dorset 2021
06 July 2022
This is the key annual document bringing together the "picture" of Dorset based on the statistical evidence. It covers 10 key areas: Population, Children, Crime, Deprivation, Diversity, Economy, Health and Care, Leisure and Culture, Natural and Historic Environment, and Older People, covering the Dorset Council area.
Downloads: 1930
-
Census 2021 First Release
28 June 2022
First release of Census data from the Office for National Statistics. Population data at local authority level.
Downloads: 1198
-
Tagged:
- Older People
- Children
- Population
-
The Indices of Deprivation 2019 - a summary report for Dorset Council
28 November 2019
The English Indices of Deprivation helps identify and prioritise areas to assist the government and other agencies (both nationally and locally) in narrowing the gap between deprived neighbourhoods and the rest of the country.
Downloads: 6612
-
Our Communities Bulletin -The Indices of Multiple Deprivation 2019
07 October 2019
Our latest Our Communities bitesize bulletin looks at the latest release of the official measure of relative deprivation for small areas in England. It focuses on Dorset Council, what’s changed since the last release in 2015 and how the data can be used. The index is measured at a small area level (called Lower-layer Super Output Areas – LSOAs) in England with an average of 1,500 residents in each. In a national context, Dorset as a whole does not score highly in relation to deprivation. However, we still have pockets of deprivation. Read the report to get the overall picture for Dorset.
Downloads: 2249
-
2018 Mid-Year Population Estimates in Dorset
10 July 2019
The Office for National Statistics have recently released the 2018 population estimates and components of change for the Dorset Council Area
Downloads: 2061
-
Tagged:
- Older People
- Children
- Population
-
Our Communities Topic report - Brexit Bulletin 2019
21 February 2019
The Office for National Statistics released an analysis showing which parts of the country might feel the most impact of Brexit, based on the representation of employees by sector. This 2019 bulletin looks at the local picture for Dorset, updating our 2017 bulletin.
Downloads: 1726
-
2016 Parish Level Mid-Year Estimates
02 October 2018
Parish level population data from best fit of Census Output Area to parish geographies. Data is in 5yr age groups rounded to the nearest five.
Downloads: 1728
-
Tagged:
- Older People
- Children
- Population
-
Childhood Obesity
28 June 2018
Childhood obesity is a growing problem in the UK. This bulletin looks at the local situation and the actions being taken to tackle it.
Downloads: 2059
-
Tagged:
- Deprivation
- Children
- Health and Wellbeing
-
2016 ONS Sub-National Population Projections
27 June 2018
The population of DCC Dorset is expected to grow by 9% over the next 25 years according to the Office for National Statistics Sub-National Population Projections.
Downloads: 1741
-
Tagged:
- Economy
- Older People
- Children
- Population
-
Carers in Dorset
14 June 2018
We are in the middle of Carers Week, which runs from 11th-17th June. The focus this year is on supporting carers to be ‘Healthy and Connected’. Research has found that 57% of carers have lost touch with family and friends, over a third (36%) feel uncomfortable talking to friends about caring and one in five carers are forced to give up work due to the demands of caring. 12% of Dorset’s population provides unpaid care, 830 of these are children under the age of 16. The following bulletin gives some information about Carers in Dorset and the impact of caring on the carer’s own health.
Downloads: 2033
-
Our Communities Topic Report - Revised Mid Year Estimates 2012 to 2016
18 April 2018
This new 'Our Communities' bulletin is about the release of revised population estimates from ONS – access to improved data means they have been able to make better estimates of the local impact of migration. Bournemouth – with its significant student population – has seen a considerable downward revision. The impact in the DCC area has been much smaller – an increase of about 200 overall, with the biggest changes evident in North Dorset (-150) and Christchurch (+160). Population data is essential for the County Council for service planning and understanding our communities.
Downloads: 1763
-
Tagged:
- Older People
- Children
- Population
-
Our Communities Topic Report - Dorset's Coastal Communities
06 October 2017
According to a report written by the Social Market Foundation, on average, coastal communities are less productive economically than non-coastal communities. They often have lower levels of pay, higher rates of unemployment and have populations with lower skill levels and poorer health. Four of Dorset's district councils are coastal communities, along with Bournemouth and Poole. The socioeconomic picture across Dorset's coastal communities varies considerably. This bulletin looks at why this matters for Dorset.
Downloads: 2500
-
Bere Regis Ward Factsheet 2016
01 October 2017
A report from Purbeck District Council providing a summary of information on the demographic and socio-economic make up of this ward within Purbeck.
Downloads: 2545
-
Castle Ward Factsheet 2016
01 October 2017
A report from Purbeck District Council providing a summary of information on the demographic and socio-economic make up of this ward within Purbeck.
Downloads: 2258
-
Creech Barrow Ward Factsheet 2016
01 October 2017
A report from Purbeck District Council providing a summary of information on the demographic and socio-economic make up of this ward within Purbeck.
Downloads: 2004
-
Langton Ward Factsheet 2016
01 October 2017
A report from Purbeck District Council providing a summary of information on the demographic and socio-economic make up of this ward within Purbeck.
Downloads: 1801
-
Lulworth & Winfrith Ward Factsheet 2016
01 October 2017
A report from Purbeck District Council providing a summary of information on the demographic and socio-economic make up of this ward within Purbeck.
Downloads: 2066
-
Lytchett Matravers Ward Factsheet 2016
01 October 2017
A report from Purbeck District Council providing a summary of information on the demographic and socio-economic make up of this ward within Purbeck.
Downloads: 3029
-
Lytchett Minster & upton East Ward Factsheet 2016
01 October 2017
A report from Purbeck District Council providing a summary of information on the demographic and socio-economic make up of this ward within Purbeck.
Downloads: 2198
-
Lytchett Minster & Upton West Ward Factsheet 2016
01 October 2017
A report from Purbeck District Council providing a summary of information on the demographic and socio-economic make up of this ward within Purbeck.
Downloads: 1999
-
St Martin Ward Factsheet 2016
01 October 2017
A report from Purbeck District Council providing a summary of information on the demographic and socio-economic make up of this ward within Purbeck.
Downloads: 1600
-
Swanage North Ward Factsheet 2016
01 October 2017
A report from Purbeck District Council providing a summary of information on the demographic and socio-economic make up of this ward within Purbeck.
Downloads: 3233
-
Swanage South Ward Factsheet 2016
01 October 2017
A report from Purbeck District Council providing a summary of information on the demographic and socio-economic make up of this ward within Purbeck.
Downloads: 4635
-
Wareham Ward Factsheet 2016
01 October 2017
A report from Purbeck District Council providing a summary of information on the demographic and socio-economic make up of this ward within Purbeck.
Downloads: 2724
-
Wool Ward Factsheet 2016
01 October 2017
A report from Purbeck District Council providing a summary of information on the demographic and socio-economic make up of this ward within Purbeck.
Downloads: 2353
-
Our Communities Topic Report - Anxiety Bulletin
23 August 2017
Surveys have shown that feelings of anxiety and well-being can change considerably through a person's life. This bulletin looks at anxiety levels across Dorset, including how certain factors can affect levels of anxiety and other measures of well-being.
Downloads: 2229
-
2016 Mid Year Estimates in Dorset
23 June 2017
A bulletin on the latest mid-year population estimates for Dorset. Looking at the current population for Dorset, its changes and why this matters.
Downloads: 1923
-
Tagged:
- Older People
- Children
- Population
-
Preparing for the 2021 Census - Testing the next Census in West Dorset, 2017
15 March 2017
The Office for National Statistics (ONS) will be carrying out a census test in West Dorset this year. This is an important part of their preparations for the 2021 Census. The attached document explains in more detail, or go to www.dorsetforyou.com/census-test-2017 for more information.
Downloads: 2002
-
Our Communities Research Report - Child Poverty in Dorset
08 December 2016
This edition includes a local perspective on a national issue, using data to build a picture of child poverty across the County and identify priority areas.
Downloads: 2348
-
Tagged:
- Deprivation
- Children
- Population
-
Our Communities Topic Report – Childhood Obesity in Dorset
01 October 2015
A recently released Public Health England report says we eat too much sugar, leading to weight gain and tooth decay. Children and young people consume three times the recommended amount of sugar on average. This Our Communities Topic report focuses on the local statistics around childhood obesity.
Downloads: 2680
-
Tagged:
- Deprivation
- Children
- Health and Wellbeing
-
Research Matters 4 - Ask Dorset Public Engagement Results
01 August 2015
Ask Dorset was the biggest community engagement exercise undertaken by Dorset County
Downloads: 2117
18 Related Datasets
Order by: Newest first
-
Indices of Deprivation 2025 - Dorset Council
Published: 23 April 2026
This pdf illustrates national deprivation levels Dorset Council. There are range of maps which look at a range of components of deprivation including health, income, employment, education and skills, living environment, crime and barriers to housing and services. There is also a multiple deprivation map that combines all these aspects of deprivation to give us an overall picture. The document also has a number of maps that look at specific aspects (sub domains) such as deprivation affecting children and outdoor living environment.
Downloads: 95
-
Indices of Deprivation 2025- National and Dorset Council Ranks
Published: 23 April 2026
The English Indices of Deprivation helps identify and prioritise areas to assist the government and other agencies both national and local in narrowing the gap between deprived neighbourhoods and the rest of the country.
Downloads: 95
-
2020 Mid-Year Estimates, Unitary Authority, Historical District and above
Published: 27 July 2021
Annual Mid-Year Estimates produced by the Office for National Statistics
Downloads: 1496
-
Tagged:
- Older People
- Children
- Population
-
2019 Ward Level Population Estimates
Published: 23 December 2020
2019 Office for National Statistics Experimental Population Estimates for Dorset wards
Downloads: 1609
-
Tagged:
- Older People
- Children
- Population
-
Births Deaths and Natural Change by Country and Local Authority
Published: 08 December 2020
Local Authority births, deaths and natural change from Mid-Years 2002 to 2019
Downloads: 1161
-
Tagged:
- Children
- Health and Wellbeing
- Population
-
2019 LSOA Level Mid-Year Estimates
Published: 08 December 2020
2019 Population estimates for Lower Super Output Area Geographies in Dorset
Downloads: 1385
-
Tagged:
- Economy
- Older People
- Children
-
Internal Migration for Mid-Years 2002-2019
Published: 08 December 2020
Internal Migration by 5 year age group for Dorset Council and Bournemouth, Christchurch & Poole Council
Downloads: 1241
-
Tagged:
- Older People
- Children
- Population
-
2018 based ONS Population Projections for Dorset
Published: 07 July 2020
2018 based Office for National Statistics Sub National Population Projections for current and former Dorset geographies in five year age groups.
Downloads: 1684
-
Tagged:
- Older People
- Children
- Population
-
2018 Parish Level Mid Year Population Estimates
Published: 23 March 2020
2018 best fit Output Area population to parish geography for all persons by five year age groups.
Downloads: 1428
-
Tagged:
- Deprivation
- Older People
- Children
- Population
-
Indices of Deprivation 2019- National and Dorset Council Ranks
Published: 03 January 2020
The English Indices of Deprivation helps identify and prioritise areas to assist the government and other agencies both national and local in narrowing the gap between deprived neighbourhoods and the rest of the country.
Downloads: 2847
-
Indices of Deprivation 2019 - Dorset East Sub Unitary Geography (SUG) Maps
Published: 11 December 2019
This pdf illustrates national deprivation levels at a small geography across Dorset East SUG area for 2019. There are sixteen maps which look at a range of components of deprivation including health, income, employment, education and skills, living environment, crime and barriers to housing and services. There is also a multiple deprivation map that combines all these aspects of deprivation to give us an overall picture. The document also has a number of maps that look at specific aspects (sub domains) such as deprivation affecting children and outdoor living environment.
Downloads: 1779
-
Indices of Deprivation 2019 - Dorset West Sub Unitary Geography (SUG) Maps
Published: 11 December 2019
This pdf illustrates national deprivation levels at a small geography across Dorset West SUG area for 2019. There are sixteen maps which look at a range of components of deprivation including health, income, employment, education and skills, living environment, crime and barriers to housing and services. There is also a multiple deprivation map that combines all these aspects of deprivation to give us an overall picture. The document also has a number of maps that look at specific aspects (sub domains) such as deprivation affecting children and outdoor living environment.
Downloads: 2334
-
Indices of Deprivation 2019 - Mid Dorset Sub Unitary Geography (SUG) Maps
Published: 11 December 2019
This pdf illustrates national deprivation levels at a small geography across Mid Dorset SUG area for 2019. There are sixteen maps which look at a range of components of deprivation including health, income, employment, education and skills, living environment, crime and barriers to housing and services. There is also a multiple deprivation map that combines all these aspects of deprivation to give us an overall picture. The document also has a number of maps that look at specific aspects (sub domains) such as deprivation affecting children and outdoor living environment.
Downloads: 1932
-
Indices of Deprivation 2019 - South East Dorset Sub Unitary Geography (SUG) Maps
Published: 11 December 2019
This pdf illustrates national deprivation levels at a small geography across South East Dorset SUG area for 2019. There are sixteen maps which look at a range of components of deprivation including health, income, employment, education and skills, living environment, crime and barriers to housing and services. There is also a multiple deprivation map that combines all these aspects of deprivation to give us an overall picture. The document also has a number of maps that look at specific aspects (sub domains) such as deprivation affecting children and outdoor living environment.
Downloads: 2359
-
Indices of Deprivation 2019 - Dorset North Sub Unitary Geography (SUG) Maps
Published: 11 December 2019
This pdf illustrates national deprivation levels at a small geography across Dorset North SUG area for 2019. There are sixteen maps which look at a range of components of deprivation including health, income, employment, education and skills, living environment, crime and barriers to housing and services. There is also a multiple deprivation map that combines all these aspects of deprivation to give us an overall picture. The document also has a number of maps that look at specific aspects (sub domains) such as deprivation affecting children and outdoor living environment.
Downloads: 2107
-
Indices of Deprivation 2019 - Dorset South Sub Unitary Geography (SUG) Maps
Published: 11 December 2019
This pdf illustrates national deprivation levels at a small geography across Dorset South SUG area for 2019. There are sixteen maps which look at a range of components of deprivation including health, income, employment, education and skills, living environment, crime and barriers to housing and services. There is also a multiple deprivation map that combines all these aspects of deprivation to give us an overall picture. The document also has a number of maps that look at specific aspects (sub domains) such as deprivation affecting children and outdoor living environment.
Downloads: 1657
-
Indices of Deprivation 2019 - Dorset Council Maps
Published: 25 November 2019
The combined map base pdf illustrates national deprivation levels at a small geography across Dorset for 2019. There are sixteen maps which look at a range of components of deprivation including health, income, employment, education and skills, living environment, crime and barriers to housing and services. There is also a multiple deprivation (IMD) map that combines all these aspects of deprivation to give us an overall picture for Dorset. The document also has a number of maps that look at specific aspects (sub domains) such as deprivation affecting children and outdoor living environment.
Downloads: 1375
-
Local Area Interactive Tool
Published: 28 February 2016
An interactive spreadsheet for comparing data about children and young people across all local authorities in England. (external website)
Downloads: 3803
-
Tagged:
- Children
- Health and Wellbeing
1 Related Dashboards
-
Indices of Deprivation 2019
This dashboard uses data published by Central Government to measure deprivation in many different facets at a small geography across Dorset.