Deprivation Topic Data
Patterns of deprivation vary across Dorset. Areas identified as having higher levels of deprivation are mainly located in urban centres such as Weymouth and Portland, while some rural communities experience deprivation related to housing and access to essential services. The English Indices of Deprivation divide the Dorset Council area into 223 geographic units.
Data from the Indices should not be compared over time. Because they are based on relative rankings, a rise or fall in an area’s position does not necessarily indicate improvement or decline; it may instead reflect changes in how other areas are performing.
Download this report (PDF)Social deprivation
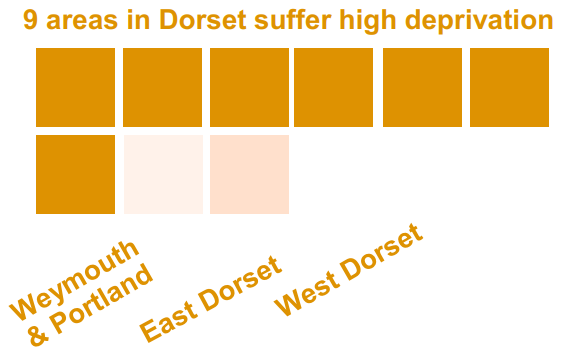
- There are 9 areas (out of a total of 223) in Dorset within the top 20% most deprived nationally for multiple deprivation.1.
- 7 of these are within Weymouth and Portland, one is in Bridport and one in Ferndown.
- The gap in life expectancy between the most deprived and least deprived areas of Dorset is 4.9 years for men and 3.2 years for women2.
- As indicators of social mobility, children receiving Free School Meals in Dorset achieve below regional and national average education standards, and South Dorset ranks third highest in the region for 25-34-year-olds in unskilled employment.4.
- 47% of Dorset's population live in rural areas3. Barriers to housing and essential services are significant in Dorset reflecting rurality and distance from services. 88 Dorset neighbourhoods fall in the 20% most deprived nationally for this measure: 30 in West Dorset, 20 in North Dorset, 18 in East Dorset, 10 in Purbeck and 10 in Weymouth & Portland.1.
Economic deprivation
- 7 neighbourhoods in Dorset fall into the top 20% nationally for income deprivation - 5 of these are in Weymouth and Portland1.
- In Dorset, about 17,200 people aged 16-64, plus 4,800 children live in 14,800 workless households. 13.5% of Dorset households were workless, very similar to the national figure6.
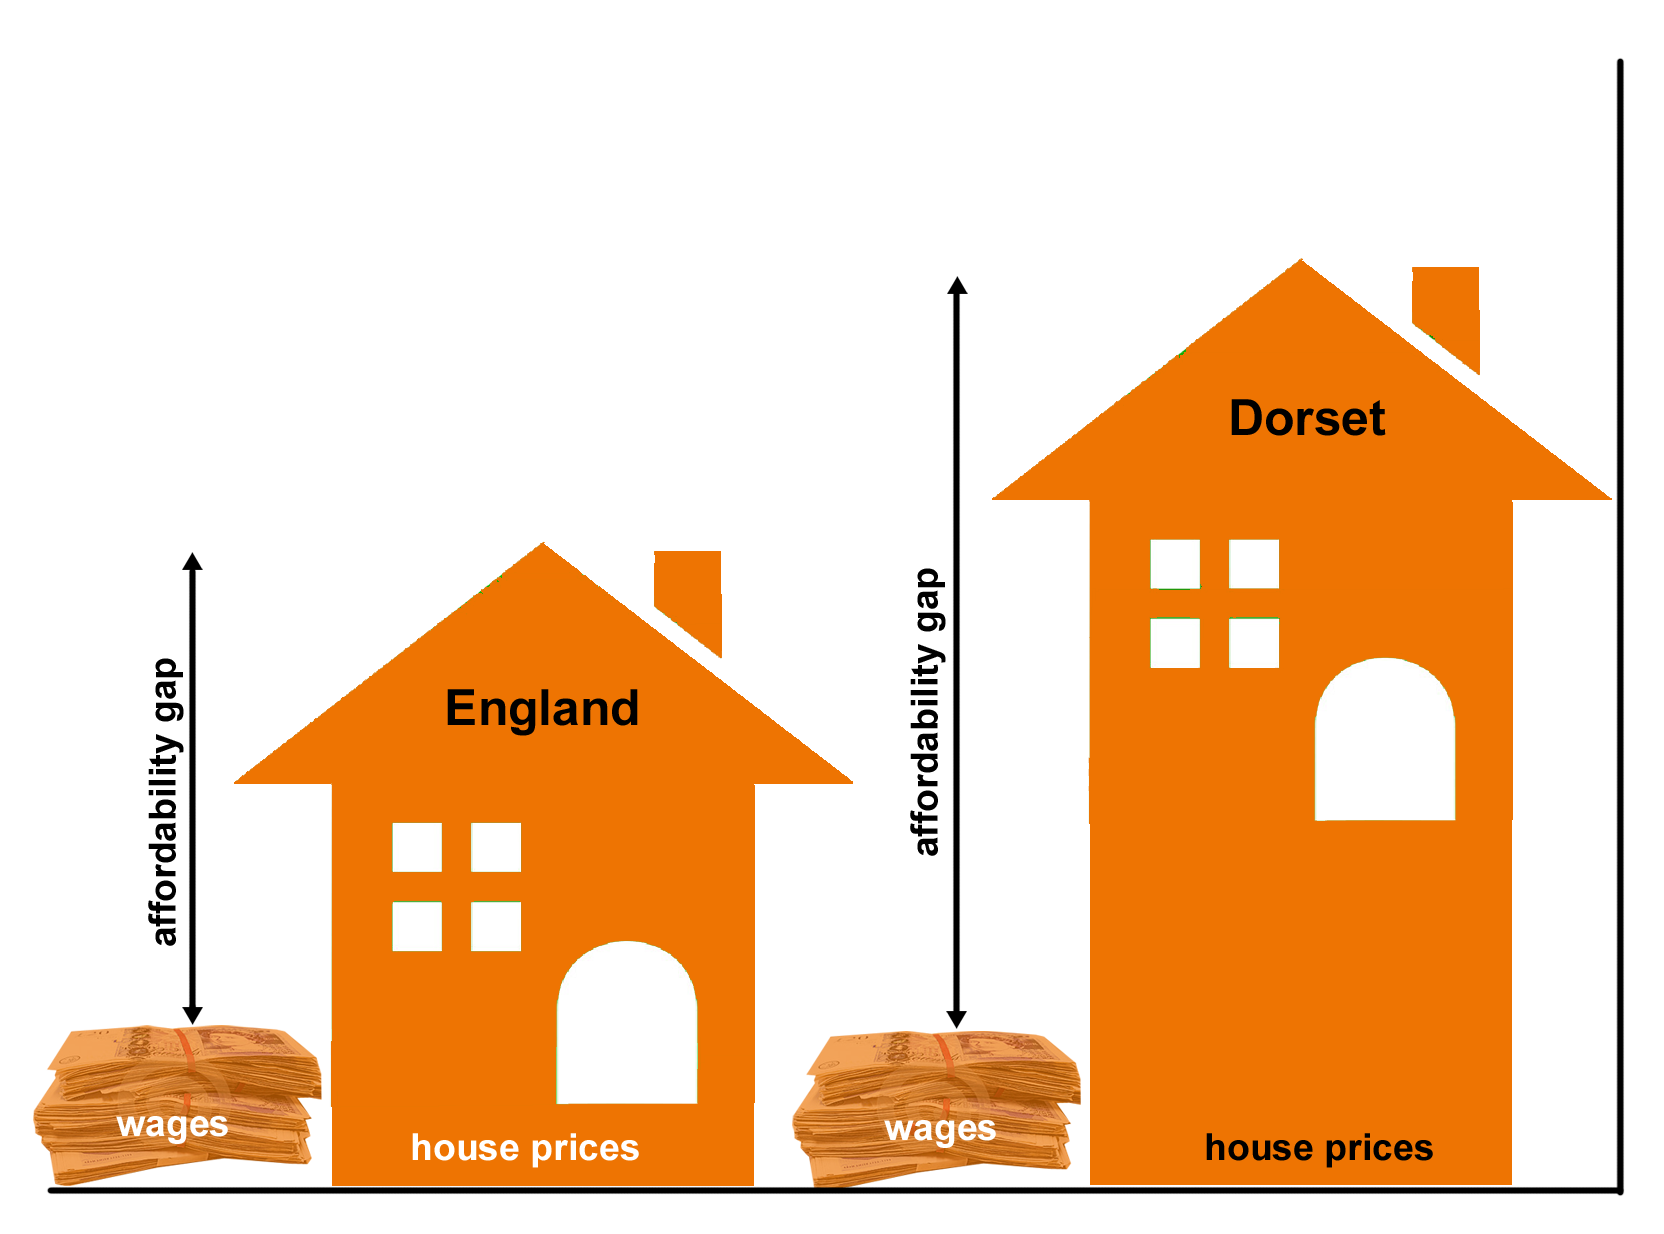
- Average house prices are 10 times higher than average earnings in Dorset7.
- Weekly earnings for people living in Dorset are 96% of national earnings5.
Health inequalities
- Health inequalities include differences in health status (such as life expectancy and prevalence of conditions), access to and experience of care, patient satisfaction, health-related behaviours, and wider determinants like housing quality.
- Nine areas in Dorset are within the top 20% most deprived for Health Deprivation in the latest Indices of Deprivation 2025, seven are in Weymouth and Portland, one in Dorchester and one in Bridport.
- In the last 10 years, female life expectancy at birth has fallen from 85.0 years to 84.8 years, while male life expectancy has stayed the same at 80.8 years.
- The coronavirus (COVID-19) pandemic led to increased mortality in 2020 and 2021, and the impact of this is seen in the regional and local area life expectancy estimates8
Headline Figures
9
Areas of Dorset in the most deprived nationally*
47%
Dorset population living in rural areas
88
Areas in the most deprived nationally for access to housing and services
19
Areas in the most deprived nationally for education
7
Areas in the most deprived nationally for income
14,800
Workless households
13.5%
Live in workless households
10 times higher
Average house prices compared to average earnings
Sources
- * Most deprived = an area falls within the top 20% nationally
- 1 English Indices of Deprivation (2025), MHCLG
- 2 Office for Health Improvement and Disparity, Public Health England 2023
- 3 Census of Population, 2021
- 4 South West Social Mobility Commision 2023 (Exeter University)
- 5 Annual Survey of Hours and Earnings (2025), ONS (full-time gross weekly earnings)
- 6 Annual Population Survey (2023), Households by combined economic activity status, ONS
- 7 Housing affordability in England and Wales QMI - Office for National Statistics
- 8Life expectancy for local areas in England, Northern Ireland and Wales: between 2001 to 2003 and 2020 to 2022
24 Reports
Order by: Newest first
-
Research Bulletin - The Indices of Multiple Deprivation 2025
23 April 2026
Our latest Research bulletin looks at the latest release of the official measure of relative deprivation for small areas in England. It focuses on Dorset Council, what’s changed since the previous release and how the data can be used. The index is measured at a small area level (called Lower-layer Super Output Areas – LSOAs) in England with an average of 1,500 residents in each. In a national context, Dorset as a whole does not score highly in relation to deprivation. However, we still have pockets of deprivation. Read the report to get the overall picture for Dorset.
Downloads: 164
-
The Indices of Deprivation 2025 - a summary report for Dorset Council
23 April 2026
The English Indices of Deprivation helps identify and prioritise areas to assist the government and other agencies (both nationally and locally) in narrowing the gap between deprived neighbourhoods and the rest of the country.
Downloads: 233
-
State of Dorset 2025 - Deprivation
27 January 2026
This is the key annual document bringing together the "picture" of Dorset based on the statistical evidence. This is just the Deprivation topic
Downloads: 357
-
Tagged:
- Deprivation
-
State of Dorset 2025
27 January 2026
This is the key annual document bringing together the "picture" of Dorset based on the statistical evidence.
Downloads: 385
-
State of Dorset 2024 - Deprivation
28 January 2025
This is the key annual document bringing together the "picture" of Dorset based on the statistical evidence. This is just the Deprivation topic
Downloads: 735
-
Tagged:
- Deprivation
-
State of Dorset 2024
28 January 2025
This is the key annual document bringing together the "picture" of Dorset based on the statistical evidence.
Downloads: 1570
-
State of Dorset 2023 - Deprivation
01 January 2023
This is the key annual document bringing together the "picture" of Dorset based on the statistical evidence. This report contains just the Deprivation topic.
Downloads: 768
-
Tagged:
- Deprivation
-
State of Dorset 2023
01 January 2023
This is the key annual document bringing together the "picture" of Dorset based on the statistical evidence. It covers eleven key areas: Economy, Deprivation, Older People, Children, Health and Care, Natural and Historic Environment, Leisure and Culture, Crime, Diversity, Population and Housing
Downloads: 1332
-
State of Dorset 2021 – Deprivation
06 July 2022
This is the key annual document bringing together the "picture" of Dorset based on the statistical evidence. This report contains the Deprivation topic and covers the Dorset Council area.
Downloads: 1589
-
Tagged:
- Deprivation
-
State of Dorset 2021
06 July 2022
This is the key annual document bringing together the "picture" of Dorset based on the statistical evidence. It covers 10 key areas: Population, Children, Crime, Deprivation, Diversity, Economy, Health and Care, Leisure and Culture, Natural and Historic Environment, and Older People, covering the Dorset Council area.
Downloads: 1930
-
The Indices of Deprivation 2019 - a summary report for Dorset Council
28 November 2019
The English Indices of Deprivation helps identify and prioritise areas to assist the government and other agencies (both nationally and locally) in narrowing the gap between deprived neighbourhoods and the rest of the country.
Downloads: 6612
-
Our Communities Bulletin -The Indices of Multiple Deprivation 2019
07 October 2019
Our latest Our Communities bitesize bulletin looks at the latest release of the official measure of relative deprivation for small areas in England. It focuses on Dorset Council, what’s changed since the last release in 2015 and how the data can be used. The index is measured at a small area level (called Lower-layer Super Output Areas – LSOAs) in England with an average of 1,500 residents in each. In a national context, Dorset as a whole does not score highly in relation to deprivation. However, we still have pockets of deprivation. Read the report to get the overall picture for Dorset.
Downloads: 2249
-
Local Economic Assessment bulletin – Inclusive Dorset
20 September 2019
This bulletin is part of a series which makes up the 2019 local economic assessment of Dorset. This bulletin looks at economic deprivation and participation in Dorset.
Downloads: 1774
-
Our Communities Topic report - Brexit Bulletin 2019
21 February 2019
The Office for National Statistics released an analysis showing which parts of the country might feel the most impact of Brexit, based on the representation of employees by sector. This 2019 bulletin looks at the local picture for Dorset, updating our 2017 bulletin.
Downloads: 1726
-
Childhood Obesity
28 June 2018
Childhood obesity is a growing problem in the UK. This bulletin looks at the local situation and the actions being taken to tackle it.
Downloads: 2059
-
Tagged:
- Deprivation
- Children
- Health and Wellbeing
-
Income Levels in Dorset 2016
02 January 2018
A study of income levels in Dorset following the publication of experimental data by the Office for National Statistics
Downloads: 1905
-
Tagged:
- Economy
- Deprivation
- Older People
-
Our Communities Topic Report - Dorset's Coastal Communities
06 October 2017
According to a report written by the Social Market Foundation, on average, coastal communities are less productive economically than non-coastal communities. They often have lower levels of pay, higher rates of unemployment and have populations with lower skill levels and poorer health. Four of Dorset's district councils are coastal communities, along with Bournemouth and Poole. The socioeconomic picture across Dorset's coastal communities varies considerably. This bulletin looks at why this matters for Dorset.
Downloads: 2500
-
Our Communities Topic Report - Anxiety Bulletin
23 August 2017
Surveys have shown that feelings of anxiety and well-being can change considerably through a person's life. This bulletin looks at anxiety levels across Dorset, including how certain factors can affect levels of anxiety and other measures of well-being.
Downloads: 2229
-
Our Communities Research Report - Child Poverty in Dorset
08 December 2016
This edition includes a local perspective on a national issue, using data to build a picture of child poverty across the County and identify priority areas.
Downloads: 2348
-
Tagged:
- Deprivation
- Children
- Population
-
Our Communities Topic Report - Crime Bulletin
05 October 2016
This edition will include a local perspective on a national issue using data to build a picture of crime across the County and identify priority areas. Last year there were 2,321 domestic abuse incidents in Dorset and 9,071 anti-social behavioural incidents across Dorset in 2015/16.
Downloads: 1756
-
Tagged:
- Deprivation
- Population
- Crime
-
Our Communities Topic Report – Mental Health in Dorset
01 January 2016
A recent Dorset CCG report highlights that one in four people at any one time will suffer from poor mental health. This report looks at those households more vulnerable to poor mental health in Dorset based on Experian data.
Downloads: 2334
-
Tagged:
- Deprivation
- Health and Wellbeing
-
Our Communities Topic Report – Jobs paid less than the living wage
01 October 2015
32,000 employee jobs in Dorset are paid less than the living wage. A decent living wage helps improve quality of life by covering the basic cost of living and reducing poverty. This edition of Our Communities pulls out a local perspective on a recently released national dataset.
Downloads: 2276
-
Tagged:
- Economy
- Deprivation
- Health and Wellbeing
-
Our Communities Topic Report – Childhood Obesity in Dorset
01 October 2015
A recently released Public Health England report says we eat too much sugar, leading to weight gain and tooth decay. Children and young people consume three times the recommended amount of sugar on average. This Our Communities Topic report focuses on the local statistics around childhood obesity.
Downloads: 2680
-
Tagged:
- Deprivation
- Children
- Health and Wellbeing
-
Research Matters 4 - Ask Dorset Public Engagement Results
01 August 2015
Ask Dorset was the biggest community engagement exercise undertaken by Dorset County
Downloads: 2117
23 Related Datasets
Order by: Newest first
-
Indices of Deprivation 2025 - Dorset Council
Published: 23 April 2026
This pdf illustrates national deprivation levels Dorset Council. There are range of maps which look at a range of components of deprivation including health, income, employment, education and skills, living environment, crime and barriers to housing and services. There is also a multiple deprivation map that combines all these aspects of deprivation to give us an overall picture. The document also has a number of maps that look at specific aspects (sub domains) such as deprivation affecting children and outdoor living environment.
Downloads: 95
-
Indices of Deprivation 2025- National and Dorset Council Ranks
Published: 23 April 2026
The English Indices of Deprivation helps identify and prioritise areas to assist the government and other agencies both national and local in narrowing the gap between deprived neighbourhoods and the rest of the country.
Downloads: 95
-
Ratio of House Prices to Earnings 2022
Published: 30 March 2023
Lower quartile affordability ratio and median earnings affordability ratio.
Downloads: 327
-
Tagged:
- Economy
- Deprivation
- Housing
-
2022 Earnings
Published: 29 March 2023
Median Earnings data on a workplace and residence basis
Downloads: 326
-
Tagged:
- Economy
- Deprivation
-
Data for EqIAs (diversity data)
Published: 14 November 2020
Various diversity data for Dorset with national comparators. For assistance in completing Equality Impact Assessments (EqIAs).
Downloads: 1387
-
2018 Parish Level Mid Year Population Estimates
Published: 23 March 2020
2018 best fit Output Area population to parish geography for all persons by five year age groups.
Downloads: 1428
-
Tagged:
- Deprivation
- Older People
- Children
- Population
-
Indices of Deprivation 2019- National and Dorset Council Ranks
Published: 03 January 2020
The English Indices of Deprivation helps identify and prioritise areas to assist the government and other agencies both national and local in narrowing the gap between deprived neighbourhoods and the rest of the country.
Downloads: 2847
-
Indices of Deprivation 2019 - Dorset East Sub Unitary Geography (SUG) Maps
Published: 11 December 2019
This pdf illustrates national deprivation levels at a small geography across Dorset East SUG area for 2019. There are sixteen maps which look at a range of components of deprivation including health, income, employment, education and skills, living environment, crime and barriers to housing and services. There is also a multiple deprivation map that combines all these aspects of deprivation to give us an overall picture. The document also has a number of maps that look at specific aspects (sub domains) such as deprivation affecting children and outdoor living environment.
Downloads: 1779
-
Indices of Deprivation 2019 - Dorset West Sub Unitary Geography (SUG) Maps
Published: 11 December 2019
This pdf illustrates national deprivation levels at a small geography across Dorset West SUG area for 2019. There are sixteen maps which look at a range of components of deprivation including health, income, employment, education and skills, living environment, crime and barriers to housing and services. There is also a multiple deprivation map that combines all these aspects of deprivation to give us an overall picture. The document also has a number of maps that look at specific aspects (sub domains) such as deprivation affecting children and outdoor living environment.
Downloads: 2334
-
Indices of Deprivation 2019 - Mid Dorset Sub Unitary Geography (SUG) Maps
Published: 11 December 2019
This pdf illustrates national deprivation levels at a small geography across Mid Dorset SUG area for 2019. There are sixteen maps which look at a range of components of deprivation including health, income, employment, education and skills, living environment, crime and barriers to housing and services. There is also a multiple deprivation map that combines all these aspects of deprivation to give us an overall picture. The document also has a number of maps that look at specific aspects (sub domains) such as deprivation affecting children and outdoor living environment.
Downloads: 1932
-
Indices of Deprivation 2019 - South East Dorset Sub Unitary Geography (SUG) Maps
Published: 11 December 2019
This pdf illustrates national deprivation levels at a small geography across South East Dorset SUG area for 2019. There are sixteen maps which look at a range of components of deprivation including health, income, employment, education and skills, living environment, crime and barriers to housing and services. There is also a multiple deprivation map that combines all these aspects of deprivation to give us an overall picture. The document also has a number of maps that look at specific aspects (sub domains) such as deprivation affecting children and outdoor living environment.
Downloads: 2359
-
Indices of Deprivation 2019 - Dorset North Sub Unitary Geography (SUG) Maps
Published: 11 December 2019
This pdf illustrates national deprivation levels at a small geography across Dorset North SUG area for 2019. There are sixteen maps which look at a range of components of deprivation including health, income, employment, education and skills, living environment, crime and barriers to housing and services. There is also a multiple deprivation map that combines all these aspects of deprivation to give us an overall picture. The document also has a number of maps that look at specific aspects (sub domains) such as deprivation affecting children and outdoor living environment.
Downloads: 2107
-
Indices of Deprivation 2019 - Dorset South Sub Unitary Geography (SUG) Maps
Published: 11 December 2019
This pdf illustrates national deprivation levels at a small geography across Dorset South SUG area for 2019. There are sixteen maps which look at a range of components of deprivation including health, income, employment, education and skills, living environment, crime and barriers to housing and services. There is also a multiple deprivation map that combines all these aspects of deprivation to give us an overall picture. The document also has a number of maps that look at specific aspects (sub domains) such as deprivation affecting children and outdoor living environment.
Downloads: 1657
-
Indices of Deprivation 2019 - Dorset Council Maps
Published: 25 November 2019
The combined map base pdf illustrates national deprivation levels at a small geography across Dorset for 2019. There are sixteen maps which look at a range of components of deprivation including health, income, employment, education and skills, living environment, crime and barriers to housing and services. There is also a multiple deprivation (IMD) map that combines all these aspects of deprivation to give us an overall picture for Dorset. The document also has a number of maps that look at specific aspects (sub domains) such as deprivation affecting children and outdoor living environment.
Downloads: 1375
-
Weymouth & Portland District Maps - Indices of Deprivation 2015
Published: 21 September 2016
This pdf illustrates national deprivation levels at a small geography across Weymouth & Portland. There are sixteen maps which look at a range of components of deprivation including health, income, employment, education and skills, living environment, crime and barriers to housing and services. There is also a multiple deprivation map that combines all these aspects of deprivation to give us an overall picture. The document also has a number of maps that look at specific aspects (sub domains) such as deprivation affecting children and outdoor living environment.
Downloads: 2267
-
Tagged:
- Deprivation
-
West Dorset District Maps - Indices of Deprivation 2015
Published: 21 September 2016
This pdf illustrates national deprivation levels at a small geography across West Dorset. There are sixteen maps which look at a range of components of deprivation including health, income, employment, education and skills, living environment, crime and barriers to housing and services. There is also a multiple deprivation map that combines all these aspects of deprivation to give us an overall picture. The document also has a number of maps that look at specific aspects (sub domains) such as deprivation affecting children and outdoor living environment.
Downloads: 2229
-
Tagged:
- Deprivation
-
Purbeck District Maps - Indices of Deprivation 2015
Published: 21 September 2016
This pdf illustrates national deprivation levels at a small geography across Purbeck. There are sixteen maps which look at a range of components of deprivation including health, income, employment, education and skills, living environment, crime and barriers to housing and services. There is also a multiple deprivation map that combines all these aspects of deprivation to give us an overall picture. The document also has a number of maps that look at specific aspects (sub domains) such as deprivation affecting children and outdoor living environment.
Downloads: 1981
-
Tagged:
- Deprivation
-
North Dorset District Maps - Indices of Deprivation 2015
Published: 21 September 2016
This pdf illustrates national deprivation levels at a small geography across North Dorset. There are sixteen maps which look at a range of components of deprivation including health, income, employment, education and skills, living environment, crime and barriers to housing and services. There is also a multiple deprivation map that combines all these aspects of deprivation to give us an overall picture. The document also has a number of maps that look at specific aspects (sub domains) such as deprivation affecting children and outdoor living environment.
Downloads: 2247
-
Tagged:
- Deprivation
-
East Dorset District Maps - Indices of Deprivation 2015
Published: 21 September 2016
This pdf illustrates national deprivation levels at a small geography across East Dorset. There are sixteen maps which look at a range of components of deprivation including health, income, employment, education and skills, living environment, crime and barriers to housing and services. There is also a multiple deprivation map that combines all these aspects of deprivation to give us an overall picture. The document also has a number of maps that look at specific aspects (sub domains) such as deprivation affecting children and outdoor living environment.
Downloads: 1980
-
Tagged:
- Deprivation
-
Christchurch District Maps - Indices of Deprivation 2015
Published: 21 September 2016
This pdf illustrates national deprivation levels at a small geography across Christchurch. There are sixteen maps which look at a range of components of deprivation including health, income, employment, education and skills, living environment, crime and barriers to housing and services. There is also a multiple deprivation map that combines all these aspects of deprivation to give us an overall picture. The document also has a number of maps that look at specific aspects (sub domains) such as deprivation affecting children and outdoor living environment.
Downloads: 1805
-
Tagged:
- Deprivation
-
ID 2015 Combined Map Base
Published: 01 December 2015
The combined Map base pdf illustrates national deprivation levels at a small geography across Dorset. There are sixteen maps which look at a range of components of deprivation including health, income, employment, education and skills, living environment, crime and barriers to housing and services. There is also a multiple deprivation map that combines all these aspects of deprivation to give us an overall picture for Dorset. The document also has a number of maps that look at specific aspects (sub domains) such as deprivation affecting children and outdoor living environment.
Downloads: 2063
-
Tagged:
- Deprivation
-
ID 2015 Report
Published: 01 December 2015
A summary report of the 2015 English Indices of Deprivation for Dorset County Council
Downloads: 4429
-
Tagged:
- Deprivation
-
English Indices of Deprivation 2015
Published: 30 September 2015
This English Indices of Deprivation helps identify and prioritise areas to assist the government and other agencies both national and local in narrowing the gap between deprived neighbourhoods and the rest of the country.
Downloads: 2948
-
Tagged:
- Economy
- Deprivation
- Crime
1 Related Dashboards
-
Indices of Deprivation 2019
This dashboard uses data published by Central Government to measure deprivation in many different facets at a small geography across Dorset.