Health and Wellbeing Topic Data
Healthy life expectancy varies across the county. Health and wellbeing are influenced by a range of factors, including where people live, how they travel, diet, employment, and use of leisure time. These behaviours affect both physical and mental health and are often interconnected.
Nine areas in Dorset are within the top 20% most deprived for Health Deprivation in the latest Indices of Deprivation 2025, seven are in Weymouth and Portland, one in Dorchester and one in Bridport.
Download this report (PDF)Health
- Healthy life expectancy shows how long people live in good health. In Dorset, there is a difference of 17 years between healthy life expectancy and overall life expectancy for men and 21 years for women. 1.
- 62% of Dorset adults are overweight or obese—slightly better than the national average (65%), but still a major health concern.2.
- 1 in 10 Dorset residents are unpaid carers—more than the national average3. That’s around 35,500 people providing vital support without pay.
- On average, 10% of adults in Dorset smoke; however the rate rises to over 20% for certain social groups. This compares to 12% across England2.
Mental health
- The suicide rate in the Dorset area is currently similar to England at 12.8 per 100,000. The suicide rate is higher for males (20.1 per 100,000) than females (6 per 100,000)15.
- National rates of probable mental health conditions have stabilised, affecting roughly 20% of children7.
- A similar stabilising picture has been seen in national armed forces personnel, with 1 in 8 being seen in military healthcare for a mental health reason8.
- In 2022-3, almost 5 million people were receiving talking therapies or secondary mental health services9.
Major Health Conditions14
- Cancer is a major cause of premature death. Early cancer diagnosis rates are lower in the most deprived areas, and cancer mortality in turn is significantly higher in the most deprived areas at 63 per 100,000 compared to 36 per 100,000.
- Of Dorset’s 60+ population, 10% are frail (15,034), with 59% of these classed as having very high frailty. The rate of hip fractures in ages 65+ are significantly higher in the most deprived areas compared to the least at 593 per 100,000 compared to 502 per 100,000.
- The number of people living with long-term conditions (LTCs) in Dorset is rising. In 2025, around 73,300 residents had one LTC, and over 150,000 were living with two or more.
Improving outcomes
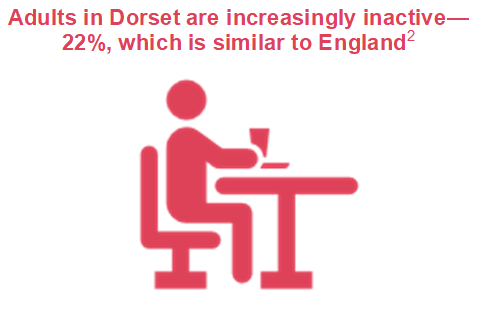
- A Movement for Movement - is a new social movement to help people living in Dorset to ‘sit a little less and move a little more’. Managed by Active Dorset - one of 42 regional Active Partnerships in England13.
- NHS Health Checks are free midlife assessments for adults aged 40–74 that screen for risks like heart disease, diabetes, kidney disease, and stroke, helping identify problems early and support lifestyle changes to improve long-term health outcomes.
- Neighbourhood health approaches are important because they tailor support to local needs, reduce health inequalities, and bring services closer to communities—making prevention and care more effective and accessible.
Headline Figures
12,000
Dorset residents likely to be living with dementia by 2035
4,328
Domestic abuse incidents in Dorset last year
17 years
Difference between male healthy and overall life expectancy
32%
Dorset Year 6 children overweight or obese
62%
Dorset adults overweight or obese
12x
LiveWell Dorset’s return on prevention
Sources
- 1 Healthy life expectancy & life expectancy at birth, Public Health Fingertips 2023
- 2 Public Health Fingertips 2023/24 (3 year range)
- 3 2021 Census, TS039
- 5 POPPI 2024
- 6 2023 Dementia Carers Count
- 7 Mental Health of Children and Young People in England 2023 - wave 4 follow-up to the 2017 survey, NHS Digital
- 8 UK armed forces mental health annual statistics: financial year 2023/24, Gov.UK
- 9 Mental health statistics: prevalence, services and funding in England, UK Parliament, 2024
- 10 Hospital admissions episodes for alcohol specific conditions, under 18s, Public Health Fingertips, 2023-2024
- 11 Alcohol and drugs prevention, treatment and recovery: why invest?, Public Health England, 12/02/18
- 12 Dorset Community Safety Partnership Performance Reporting, 2025
- 13 Active Dorset
- 14 Dorset Joint Strategic Needs Assessment November 2025, Public Health Dorset
38 Reports
Order by: Newest first
-
Research Bulletin - The Indices of Multiple Deprivation 2025
23 April 2026
Our latest Research bulletin looks at the latest release of the official measure of relative deprivation for small areas in England. It focuses on Dorset Council, what’s changed since the previous release and how the data can be used. The index is measured at a small area level (called Lower-layer Super Output Areas – LSOAs) in England with an average of 1,500 residents in each. In a national context, Dorset as a whole does not score highly in relation to deprivation. However, we still have pockets of deprivation. Read the report to get the overall picture for Dorset.
Downloads: 164
-
The Indices of Deprivation 2025 - a summary report for Dorset Council
23 April 2026
The English Indices of Deprivation helps identify and prioritise areas to assist the government and other agencies (both nationally and locally) in narrowing the gap between deprived neighbourhoods and the rest of the country.
Downloads: 233
-
State of Dorset 2025 - Health and Wellbeing
27 January 2026
This is the key annual document bringing together the "picture" of Dorset based on the statistical evidence. This is just the Health and Wellbeing topic
Downloads: 215
-
Tagged:
- Health and Wellbeing
-
State of Dorset 2025
27 January 2026
This is the key annual document bringing together the "picture" of Dorset based on the statistical evidence.
Downloads: 385
-
State of Dorset 2024 - Health and Wellbeing
28 January 2025
This is the key annual document bringing together the "picture" of Dorset based on the statistical evidence. This is just the Health and Wellbeing topic
Downloads: 583
-
Tagged:
- Health and Wellbeing
-
State of Dorset 2024
28 January 2025
This is the key annual document bringing together the "picture" of Dorset based on the statistical evidence.
Downloads: 1570
-
State of Dorset 2023 - Health and Wellbeing
01 January 2023
This is the key annual document bringing together the "picture" of Dorset based on the statistical evidence. This report contains just the Health and Wellbeing topic.
Downloads: 633
-
Tagged:
- Health and Wellbeing
-
State of Dorset 2023
01 January 2023
This is the key annual document bringing together the "picture" of Dorset based on the statistical evidence. It covers eleven key areas: Economy, Deprivation, Older People, Children, Health and Care, Natural and Historic Environment, Leisure and Culture, Crime, Diversity, Population and Housing
Downloads: 1332
-
State of Dorset 2021 – Health and Wellbeing
06 July 2022
This is the key annual document bringing together the "picture" of Dorset based on the statistical evidence. This report contains the Health and Wellbeing topic and covers the Dorset Council area.
Downloads: 1344
-
Tagged:
- Health and Wellbeing
-
State of Dorset 2021
06 July 2022
This is the key annual document bringing together the "picture" of Dorset based on the statistical evidence. It covers 10 key areas: Population, Children, Crime, Deprivation, Diversity, Economy, Health and Care, Leisure and Culture, Natural and Historic Environment, and Older People, covering the Dorset Council area.
Downloads: 1930
-
The Indices of Deprivation 2019 - a summary report for Dorset Council
28 November 2019
The English Indices of Deprivation helps identify and prioritise areas to assist the government and other agencies (both nationally and locally) in narrowing the gap between deprived neighbourhoods and the rest of the country.
Downloads: 6612
-
Our Communities Bulletin -The Indices of Multiple Deprivation 2019
07 October 2019
Our latest Our Communities bitesize bulletin looks at the latest release of the official measure of relative deprivation for small areas in England. It focuses on Dorset Council, what’s changed since the last release in 2015 and how the data can be used. The index is measured at a small area level (called Lower-layer Super Output Areas – LSOAs) in England with an average of 1,500 residents in each. In a national context, Dorset as a whole does not score highly in relation to deprivation. However, we still have pockets of deprivation. Read the report to get the overall picture for Dorset.
Downloads: 2249
-
Our Communities Topic report - Brexit Bulletin 2019
21 February 2019
The Office for National Statistics released an analysis showing which parts of the country might feel the most impact of Brexit, based on the representation of employees by sector. This 2019 bulletin looks at the local picture for Dorset, updating our 2017 bulletin.
Downloads: 1726
-
Childhood Obesity
28 June 2018
Childhood obesity is a growing problem in the UK. This bulletin looks at the local situation and the actions being taken to tackle it.
Downloads: 2059
-
Tagged:
- Deprivation
- Children
- Health and Wellbeing
-
Carers in Dorset
14 June 2018
We are in the middle of Carers Week, which runs from 11th-17th June. The focus this year is on supporting carers to be ‘Healthy and Connected’. Research has found that 57% of carers have lost touch with family and friends, over a third (36%) feel uncomfortable talking to friends about caring and one in five carers are forced to give up work due to the demands of caring. 12% of Dorset’s population provides unpaid care, 830 of these are children under the age of 16. The following bulletin gives some information about Carers in Dorset and the impact of caring on the carer’s own health.
Downloads: 2033
-
Our Communities - Fitness and Wellbeing
11 May 2018
A bulletin about physical fitness and mental well-being in Dorset, to coincide with national walking month and mental health awareness week.
Downloads: 1604
-
Our Communities Topic Report - Dorset's Coastal Communities
06 October 2017
According to a report written by the Social Market Foundation, on average, coastal communities are less productive economically than non-coastal communities. They often have lower levels of pay, higher rates of unemployment and have populations with lower skill levels and poorer health. Four of Dorset's district councils are coastal communities, along with Bournemouth and Poole. The socioeconomic picture across Dorset's coastal communities varies considerably. This bulletin looks at why this matters for Dorset.
Downloads: 2500
-
Bere Regis Ward Factsheet 2016
01 October 2017
A report from Purbeck District Council providing a summary of information on the demographic and socio-economic make up of this ward within Purbeck.
Downloads: 2545
-
Castle Ward Factsheet 2016
01 October 2017
A report from Purbeck District Council providing a summary of information on the demographic and socio-economic make up of this ward within Purbeck.
Downloads: 2258
-
Creech Barrow Ward Factsheet 2016
01 October 2017
A report from Purbeck District Council providing a summary of information on the demographic and socio-economic make up of this ward within Purbeck.
Downloads: 2004
-
Langton Ward Factsheet 2016
01 October 2017
A report from Purbeck District Council providing a summary of information on the demographic and socio-economic make up of this ward within Purbeck.
Downloads: 1801
-
Lulworth & Winfrith Ward Factsheet 2016
01 October 2017
A report from Purbeck District Council providing a summary of information on the demographic and socio-economic make up of this ward within Purbeck.
Downloads: 2066
-
Lytchett Matravers Ward Factsheet 2016
01 October 2017
A report from Purbeck District Council providing a summary of information on the demographic and socio-economic make up of this ward within Purbeck.
Downloads: 3029
-
Lytchett Minster & upton East Ward Factsheet 2016
01 October 2017
A report from Purbeck District Council providing a summary of information on the demographic and socio-economic make up of this ward within Purbeck.
Downloads: 2198
-
Lytchett Minster & Upton West Ward Factsheet 2016
01 October 2017
A report from Purbeck District Council providing a summary of information on the demographic and socio-economic make up of this ward within Purbeck.
Downloads: 1999
-
St Martin Ward Factsheet 2016
01 October 2017
A report from Purbeck District Council providing a summary of information on the demographic and socio-economic make up of this ward within Purbeck.
Downloads: 1600
-
Swanage North Ward Factsheet 2016
01 October 2017
A report from Purbeck District Council providing a summary of information on the demographic and socio-economic make up of this ward within Purbeck.
Downloads: 3233
-
Swanage South Ward Factsheet 2016
01 October 2017
A report from Purbeck District Council providing a summary of information on the demographic and socio-economic make up of this ward within Purbeck.
Downloads: 4635
-
Wareham Ward Factsheet 2016
01 October 2017
A report from Purbeck District Council providing a summary of information on the demographic and socio-economic make up of this ward within Purbeck.
Downloads: 2724
-
Wool Ward Factsheet 2016
01 October 2017
A report from Purbeck District Council providing a summary of information on the demographic and socio-economic make up of this ward within Purbeck.
Downloads: 2353
-
Our Communities Topic Report - Anxiety Bulletin
23 August 2017
Surveys have shown that feelings of anxiety and well-being can change considerably through a person's life. This bulletin looks at anxiety levels across Dorset, including how certain factors can affect levels of anxiety and other measures of well-being.
Downloads: 2229
-
Preparing for the 2021 Census - Testing the next Census in West Dorset, 2017
15 March 2017
The Office for National Statistics (ONS) will be carrying out a census test in West Dorset this year. This is an important part of their preparations for the 2021 Census. The attached document explains in more detail, or go to www.dorsetforyou.com/census-test-2017 for more information.
Downloads: 2002
-
Our Communities Topic Report – Mental Health in Dorset
01 January 2016
A recent Dorset CCG report highlights that one in four people at any one time will suffer from poor mental health. This report looks at those households more vulnerable to poor mental health in Dorset based on Experian data.
Downloads: 2334
-
Tagged:
- Deprivation
- Health and Wellbeing
-
Our Communities Topic Report – Jobs paid less than the living wage
01 October 2015
32,000 employee jobs in Dorset are paid less than the living wage. A decent living wage helps improve quality of life by covering the basic cost of living and reducing poverty. This edition of Our Communities pulls out a local perspective on a recently released national dataset.
Downloads: 2276
-
Tagged:
- Economy
- Deprivation
- Health and Wellbeing
-
Our Communities Topic Report – Childhood Obesity in Dorset
01 October 2015
A recently released Public Health England report says we eat too much sugar, leading to weight gain and tooth decay. Children and young people consume three times the recommended amount of sugar on average. This Our Communities Topic report focuses on the local statistics around childhood obesity.
Downloads: 2680
-
Tagged:
- Deprivation
- Children
- Health and Wellbeing
-
Our Communities Topic Report – Loneliness and Social Isolation in Dorset
01 August 2015
Over recent years, the problems associated with loneliness and social isolation, especially among older people, has become a national priority. One in five Dorset households are vulnerable to social isolation/loneliness. We need to identify areas where loneliness is most prevalent so resources can be targeted at the people and places that need them most.
Downloads: 2521
-
Tagged:
- Older People
- Health and Wellbeing
-
Research Matters 4 - Ask Dorset Public Engagement Results
01 August 2015
Ask Dorset was the biggest community engagement exercise undertaken by Dorset County
Downloads: 2117
-
Census Story - Health in Dorset
01 August 2013
The Census of Population 2011 included a question on the individual’s perception of their health, "How is your health in general?" Respondents were asked to rate their health as ‘very good’, ‘good’, ‘fair’, ‘bad’ or ‘very bad’.
Downloads: 1555
-
Tagged:
- Health and Wellbeing
16 Related Datasets
Order by: Newest first
-
Indices of Deprivation 2025 - Dorset Council
Published: 23 April 2026
This pdf illustrates national deprivation levels Dorset Council. There are range of maps which look at a range of components of deprivation including health, income, employment, education and skills, living environment, crime and barriers to housing and services. There is also a multiple deprivation map that combines all these aspects of deprivation to give us an overall picture. The document also has a number of maps that look at specific aspects (sub domains) such as deprivation affecting children and outdoor living environment.
Downloads: 95
-
Indices of Deprivation 2025- National and Dorset Council Ranks
Published: 23 April 2026
The English Indices of Deprivation helps identify and prioritise areas to assist the government and other agencies both national and local in narrowing the gap between deprived neighbourhoods and the rest of the country.
Downloads: 95
-
Births Deaths and Natural Change by Country and Local Authority
Published: 08 December 2020
Local Authority births, deaths and natural change from Mid-Years 2002 to 2019
Downloads: 1161
-
Tagged:
- Children
- Health and Wellbeing
- Population
-
Data for EqIAs (diversity data)
Published: 14 November 2020
Various diversity data for Dorset with national comparators. For assistance in completing Equality Impact Assessments (EqIAs).
Downloads: 1387
-
Indices of Deprivation 2019- National and Dorset Council Ranks
Published: 03 January 2020
The English Indices of Deprivation helps identify and prioritise areas to assist the government and other agencies both national and local in narrowing the gap between deprived neighbourhoods and the rest of the country.
Downloads: 2847
-
Indices of Deprivation 2019 - Dorset East Sub Unitary Geography (SUG) Maps
Published: 11 December 2019
This pdf illustrates national deprivation levels at a small geography across Dorset East SUG area for 2019. There are sixteen maps which look at a range of components of deprivation including health, income, employment, education and skills, living environment, crime and barriers to housing and services. There is also a multiple deprivation map that combines all these aspects of deprivation to give us an overall picture. The document also has a number of maps that look at specific aspects (sub domains) such as deprivation affecting children and outdoor living environment.
Downloads: 1779
-
Indices of Deprivation 2019 - Dorset West Sub Unitary Geography (SUG) Maps
Published: 11 December 2019
This pdf illustrates national deprivation levels at a small geography across Dorset West SUG area for 2019. There are sixteen maps which look at a range of components of deprivation including health, income, employment, education and skills, living environment, crime and barriers to housing and services. There is also a multiple deprivation map that combines all these aspects of deprivation to give us an overall picture. The document also has a number of maps that look at specific aspects (sub domains) such as deprivation affecting children and outdoor living environment.
Downloads: 2334
-
Indices of Deprivation 2019 - Mid Dorset Sub Unitary Geography (SUG) Maps
Published: 11 December 2019
This pdf illustrates national deprivation levels at a small geography across Mid Dorset SUG area for 2019. There are sixteen maps which look at a range of components of deprivation including health, income, employment, education and skills, living environment, crime and barriers to housing and services. There is also a multiple deprivation map that combines all these aspects of deprivation to give us an overall picture. The document also has a number of maps that look at specific aspects (sub domains) such as deprivation affecting children and outdoor living environment.
Downloads: 1932
-
Indices of Deprivation 2019 - South East Dorset Sub Unitary Geography (SUG) Maps
Published: 11 December 2019
This pdf illustrates national deprivation levels at a small geography across South East Dorset SUG area for 2019. There are sixteen maps which look at a range of components of deprivation including health, income, employment, education and skills, living environment, crime and barriers to housing and services. There is also a multiple deprivation map that combines all these aspects of deprivation to give us an overall picture. The document also has a number of maps that look at specific aspects (sub domains) such as deprivation affecting children and outdoor living environment.
Downloads: 2359
-
Indices of Deprivation 2019 - Dorset North Sub Unitary Geography (SUG) Maps
Published: 11 December 2019
This pdf illustrates national deprivation levels at a small geography across Dorset North SUG area for 2019. There are sixteen maps which look at a range of components of deprivation including health, income, employment, education and skills, living environment, crime and barriers to housing and services. There is also a multiple deprivation map that combines all these aspects of deprivation to give us an overall picture. The document also has a number of maps that look at specific aspects (sub domains) such as deprivation affecting children and outdoor living environment.
Downloads: 2107
-
Indices of Deprivation 2019 - Dorset South Sub Unitary Geography (SUG) Maps
Published: 11 December 2019
This pdf illustrates national deprivation levels at a small geography across Dorset South SUG area for 2019. There are sixteen maps which look at a range of components of deprivation including health, income, employment, education and skills, living environment, crime and barriers to housing and services. There is also a multiple deprivation map that combines all these aspects of deprivation to give us an overall picture. The document also has a number of maps that look at specific aspects (sub domains) such as deprivation affecting children and outdoor living environment.
Downloads: 1657
-
Indices of Deprivation 2019 - Dorset Council Maps
Published: 25 November 2019
The combined map base pdf illustrates national deprivation levels at a small geography across Dorset for 2019. There are sixteen maps which look at a range of components of deprivation including health, income, employment, education and skills, living environment, crime and barriers to housing and services. There is also a multiple deprivation (IMD) map that combines all these aspects of deprivation to give us an overall picture for Dorset. The document also has a number of maps that look at specific aspects (sub domains) such as deprivation affecting children and outdoor living environment.
Downloads: 1375
-
Local Area Interactive Tool
Published: 28 February 2016
An interactive spreadsheet for comparing data about children and young people across all local authorities in England. (external website)
Downloads: 3803
-
Tagged:
- Children
- Health and Wellbeing
-
Public Health Outcomes
Published: 28 February 2016
Find out about differences in life expectancy and healthy life expectancy between communities. (external website)
Downloads: 2167
-
Tagged:
- Health and Wellbeing
-
POPPI: Projecting Older People Information
Published: 28 July 2014
A population based database providing information on older people (external website)
Downloads: 6832
-
Tagged:
- Older People
- Health and Wellbeing
-
PANSI: Projecting Adult Needs and Service Information
Published: 28 July 2014
A population based database providing information on adults with special needs (external website)
Downloads: 2653
-
Tagged:
- Health and Wellbeing
1 Related Dashboards
-
Indices of Deprivation 2019
This dashboard uses data published by Central Government to measure deprivation in many different facets at a small geography across Dorset.